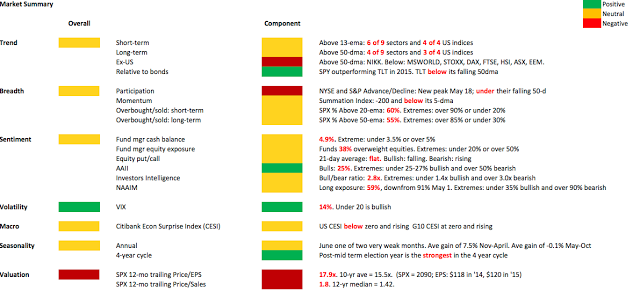
Summary: US equities are slowly trending higher but have refused to become either oversold or overbought during the past several months. They reached slightly overbought last week; thus, an opportunity to finally build on strength has once again arrived. But breadth has not washed out to a low and sentiment is still leaning bullish. None of this suggests a runaway to the upside is imminent.
Seasonality during the upcoming week has been uniformly bad the past 17 years. The good news: among the summer months, July is a bullish standout, something to keep in mind should stocks encounter weakness over the next several days.
US equities moved higher this past week: SPX and DJIA gained about 0.7% while NDX and RUT gained about 1.4%. Of note, small caps and the broad Nasdaq index (COMPQ) closed at new all-time highs (ATH).
Foreign indices closed lower: Europe lost 1% and emerging markets lost 0.5%. Most foreign markets are making lower lows under falling 50-dma.
US equities rose to relative highs at the end of last week before turning down on Friday. Since December, US stocks have not been able to move much higher after becoming slightly overbought (daily RSI(5) over 70; arrows). The only exception was in February, and all of those gains were given back in March.
Bottom line for the week ahead: is this pattern set to change?
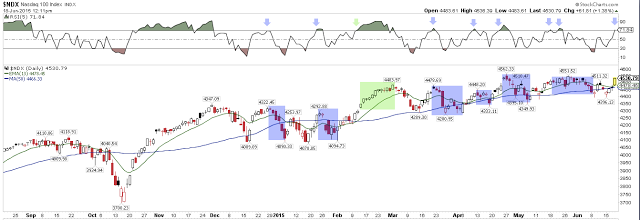
NDX continues to trend slowly higher. Over the last 6 months, the index has stair stepped higher, spending 2-3 months at each step. The index ended the week near resistance; interestingly, after 3 touches of resistance (arrows), the index has moved a step higher. A revisit to resistance (4550-4560) a 4th time suggests a 'breakout' higher.
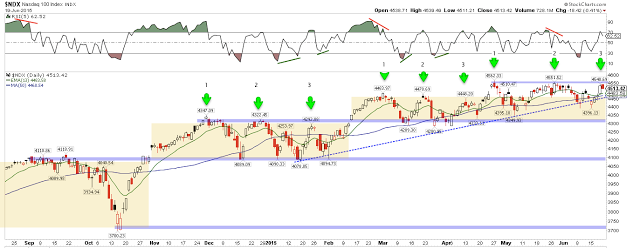
Small caps closed at a new ATH this past week. The index has the cleanest uptrend of the 4 US indices. It closed the week overbought; while that is a sign of strength, in the past year, every time RSI(5) has exceeded 70 (top panel) all subsequent gains have been given back (arrows).
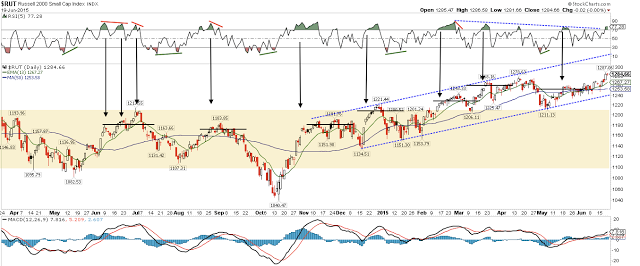
Like the other indices, SPX hit overbought this past week. It hasn't been able to hold gains from overbought levels since December. It's in an uptrend, but just barely. The lows this past week were at the same levels as in late December.
The lows this past week and last week did not produce a washout in breadth as at prior durable lows. Instead, breadth made a slightly lower low before stocks bounced. This suggests that the sluggish uptrend continues with more choppy downside ahead as well.
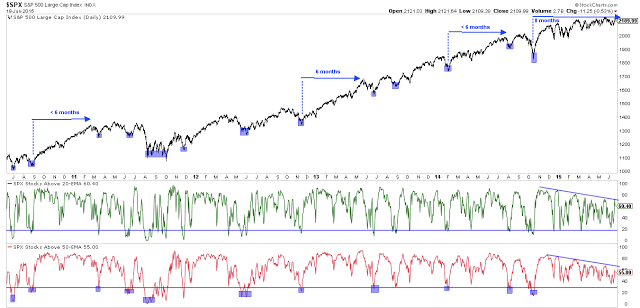
Importantly, small caps and the broad NASDAQ index (COMPQ, not the Nasdaq 100, NDX) are leading the upside. In other words, investors are not hiding out in the relative safety of large cap stocks, they are buying the most speculative stocks. That investors are pushing these indices higher, and not SPX or the Dow, suggests sentiment is mostly bullish. In fact, equity fund inflows this past week were the highest in 3 months (article).
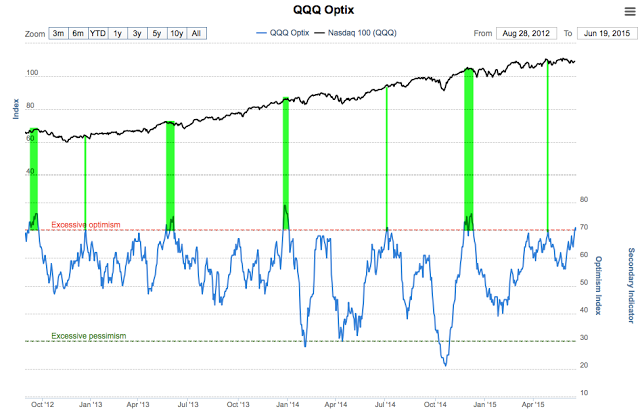
That bullish sentiment can be seen in the following charts from Sentimentrader. His "Optix" indicator combines put/call, volatility and fund flows, among other metrics. The Optix sentiment for NDX (PowerShares QQQ Trust Series 1 (NASDAQ:QQQ)) ended last week very bullish; prior times in the past 3 years are highlighted in green. Upside was limited and a lower low was ahead.
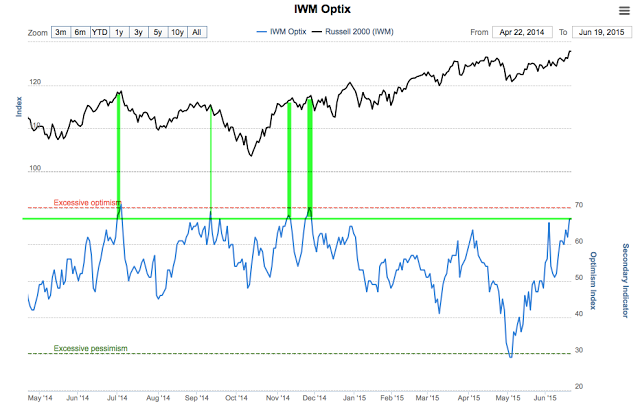
The same is true for small caps (via iShares Russell 2000 ETF (ARCA:IWM)); current sentiment is the most bullish since December. Prior times in the past year are highlighted in green.
So, overall, US indices are meandering slowly higher, making their best advances after their largest falls and failing to follow through on strength. Breadth has not washed out to a low and sentiment is leaning bullish. None of this suggests a runaway to the upside is imminent.
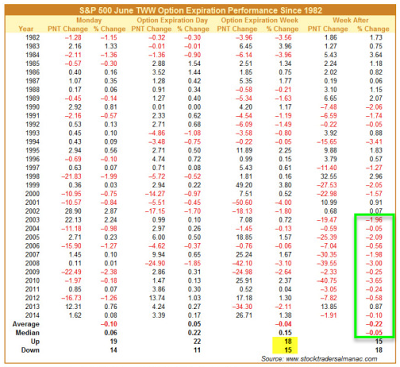
The week ahead (the week after June options expiration) has been consistently bearish for years. The week has been lower 11 of the past 12 years; the one exception followed a loss of more than 2% during June OpX (2013). When June OpX has been higher (like last week), the next week has been lower every year since 1998 (chart from Almanac Trader).
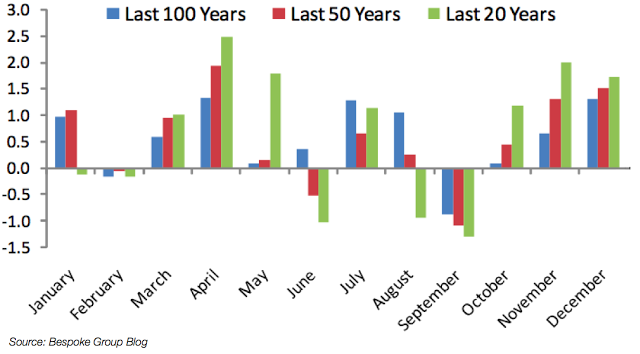
Importantly, weakness this coming week, especially in the extreme, would be a nice set-up for July. Among the summer months, July is a bullish standout. It has seen higher prices over the past 20, 50 and 100 years (chart from Bespoke).
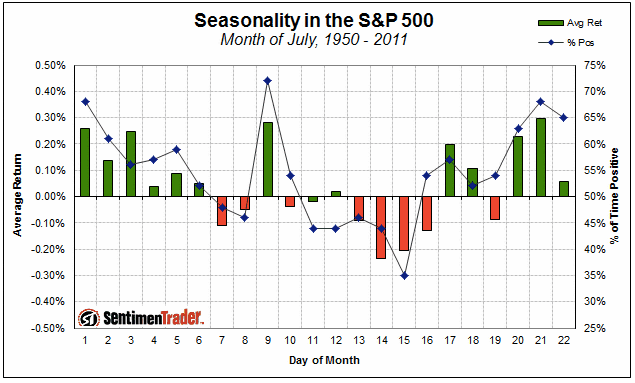
The month starts strong; most of the first half of the month is typically bullish (chart from Sentimentrader).
All of this suggests that the best set-up for the next month would be for stocks to retreat from their slightly overbought levels this week, allowing sentiment to become less bullish. Drama from Greece would be a welcome catalyst.
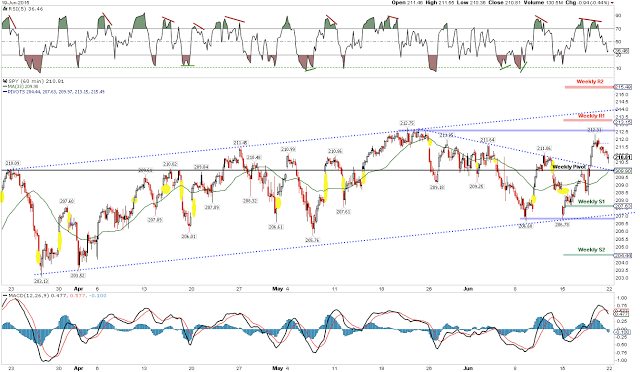
The SPDR S&P 500 ETF (ARCA:SPY) is firmly in the middle of a rising channel from the February low. Price broke above a 4 week downtrend line this week; there's a double bottom near 207 and the first higher high since late May near 212. A backtest of that trend line (dashed) would coincide with the weekly pivot (210). The 20-dma, 50-dma and 13-ema are all near 210 as well; an important level to start the week.
On the macro front, it's a busy week. New home sales are on Monday, durable goods on Tuesday, GDP on Wednesday and PCE on Thursday.
Our weekly summary table follows.
