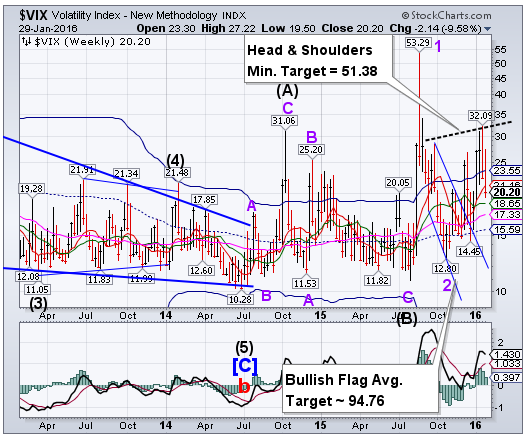
VIX continued its retracement from the new Head & Shoulders formation to close beneath Short-term support at 21.16. For intermediate-term investors, it remains on a buy signal (NYSE sell signal). The close above the neckline suggests a very robust follow-through rally in the following weeks.
Despite a recent surge, the so-called fear index remains in a trading range that suggests investors aren’t expecting a recession this year.
With an average of about 24 this month, the Chicago Board Options Exchange Volatility Index is consistent with a scenario of positive, though low, economic growth, according to a Goldman Sachs Group Inc (N:GS) report. The “Red Zone” happens when the VIX is above 25 and climbing, which historically coincides with flat or negative U.S. gross domestic product.
SPX closed a second positive week.
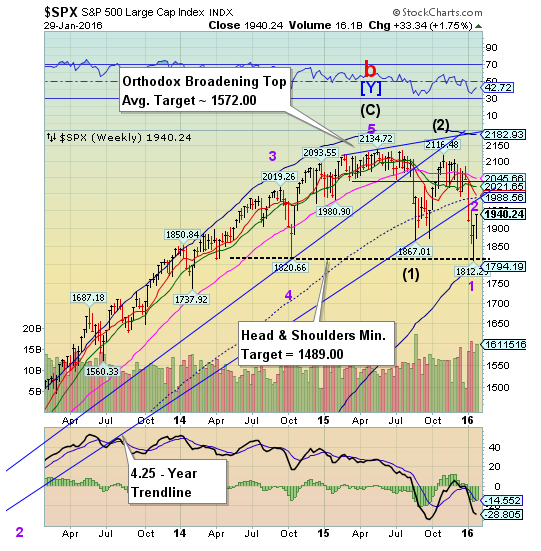
The SPX managed to end the month of January just under a 50% retracement of its recent decline. Traders are eagerly expecting SPX to rally even more to the combination weekly mid-cycle resistance and 4.25-year trendline, both at 1988.56. However, the fuel for the rally, corporate pension contributions with a deadline of January 15, may be over as a substantial amount were contributed this week. If so, the neckline awaits the next downdraft, which may come faster than expected.
(WSJ) U.S. stocks climbed on Friday, boosted by a surprise interest rate cut in Japan, at the end of a turbulent month for the financial markets.
The Dow Jones Industrial Average ended Friday trade up 394 points, or 2.4% to 16463. The S&P 500 finished 2.4% higher and the Nasdaq Composite rose 2.4%.
Following steep declines in the first half of the month, many traders and analysts had been embracing the relative market stabilization from stocks to crude oil in recent trading sessions.
NDX ekes out a minimal Fibonacci retracement.
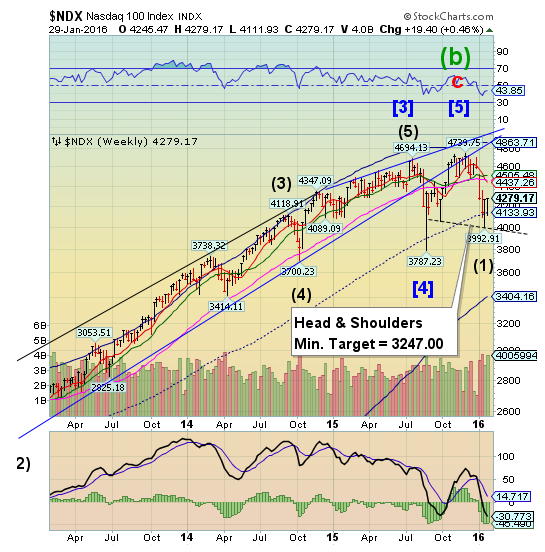
NDX rallied again this week, but only a few points above the 38.2% Fibonacci retracement level. This is not a good showing for the investors’ darling of 2015. Counter-trend rallies are much quicker than declines, suggesting a high may be close by.
(LATimes) Stocks soared on January’s last trading day, with Microsoft (O:MSFT), Visa (N:V) and other tech stocks making the biggest gains in a broad market rally.
Indexes rose throughout the day and finished with their biggest gains in about five months. Asian stocks jumped after the Bank of Japan moved to stimulate the economy, and European markets also rose. In the U.S, tech stocks climbed following strong fourth-quarter results from Microsoft and Visa. Materials companies and banks also made large gains, and the price of oil rose for the fourth day in a row.
High Yield Bond Index rallies toward the trendline.
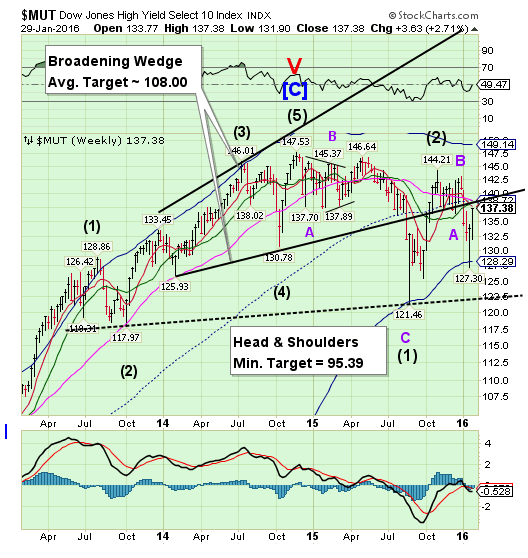
The High Yield Index continued its rally toward the Broadening Top trendline and mid-Cycle resistance at 138.72. This constitutes a 60% retracement of its decline. At this rate, it may be ready for an imminent reversal to challenge the neckline of the Head & Shoulders formation near 122.50. MUT remains on an intermediate-term sell signal.
(MarketWatch) The U.S. high-yield, or “junk” bond market, has started the year on the back foot, which history suggests could be a very bad sign for the stock market.
The asset class is showing negative returns of almost 2% for the year so far, and negative returns of 7.6% for the last six months, according to The Bank of America Merrill Lynch (N:BAC) U.S. High Yield Index.
The euro continues its 2-month-old consolidation.
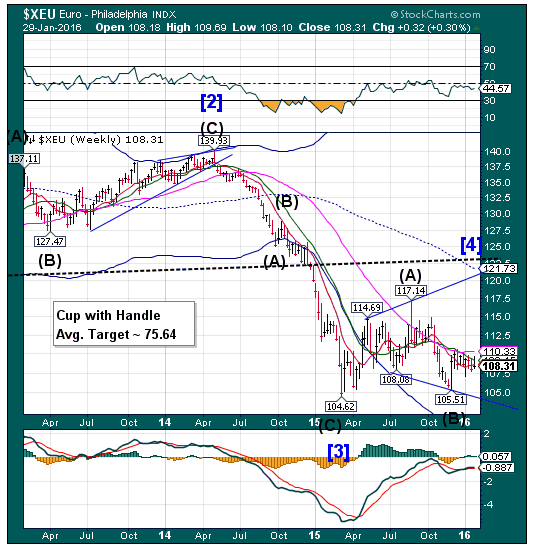
The euro remains continued its consolidation beneath weekly Intermediate-term resistance at 108.45. Once above the resistance zone, it is likely to target the 117.00 – 121.73 range before reversing down. It is these kinds of retracements that shake out the short sellers.
(Bloomberg) Euro-area economic confidence slumped more than analysts predicted in January, strengthening the European Central Bank’s case for increasing stimulus.
An index of executive and consumer confidence fell to 105 from a revised 106.7 in December, the European Commission in Brussels said on Thursday. That’s the lowest since August and compares to a median estimate for a drop to 106.4 in a Bloomberg survey of economists. The figure for December was previously reported at 106.8
EuroStoxx bounce stalls under a trendline.
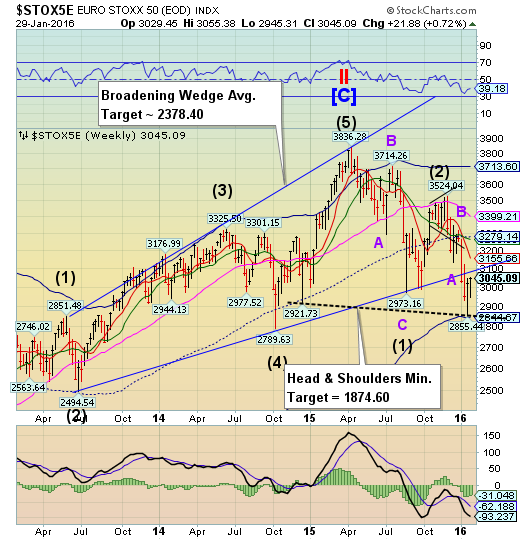
EuroStoxx consolidated in a 100-point range beneath the Broadening Top trendline. This conforms to what was suggested last week, “it is likely that either Stoxx consolidate in a sideways fashion or resume its decline from here.” The decline resumes imminently. Without the Bank of Japan rate decision, Stoxx may have ended the week at a loss.
(CNBC) European equities closed sharply higher on Friday after the Bank of Japan surprised global markets by adopting negative interest rates for the first time.
The pan-European STOXX 600 finished up 2.2 percent provisionally. On the week it closed up 1.2 percent provisionally.
London's FTSE 100 led the way, ending up 2.6 percent on the day. France's CAC and Germany's DAX closed up 2.2 and 1.6 percent higher, respectively.
The yen retraces to Long-term support.
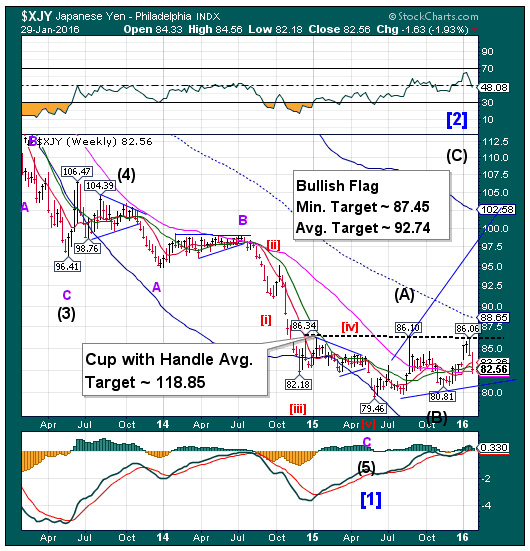
The yen continued its retracement of the Oct.-Jan. rally to close just above weekly Long-term support at 82.37. The decline constitutes a 74% retracement of the recent rally to 86.06. The period of weakness appears to be over, which allows the rally to resume in strength into mid-February. The two targets are not incompatible. The (short-term) Flag target may come in a matter of weeks, while the Cup with Handle target may take months.
(ZeroHedge) As we noted earlier, in a paradoxical U-turn, one which caught everyone by surprise as a result of Kuroda's own promise just one week ago not to engage in NIRP...
... and two months after the ECB's December 3 disappointing announcement led to a historic surge in the EUR, today countless macro hedge funds have been left reeling with huge losses once again, as many had recently turned bullish on the yen...
The Nikkei bounces with the help of the BOJ.
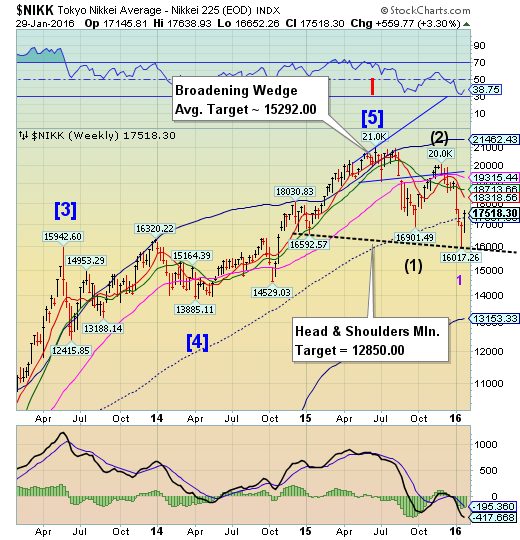
The entirety of this week’s ramp in the Nikkei was accomplished on Friday, after the Bank of Japan lowered interest rates. Even so, the total retracement of its decline from December 1 amounted to a fraction over 41%. The sell signal may be reinstated on a decline beneath mid-Cycle support at 17307.88.
(ZeroHedge) By surprising markets with a move to a negative deposit rate, the Bank of Japan gave investors temporary reprieve, providing a much needed opportunity to pare portfolio risk at better prices. Unfortunately, the improvement in financial asset prices will be short-lived; except, of course, for long-maturity Treasuries.
- As I wrote on January 4th, “Investors should be careful not underestimating just how far long-maturity Treasury yields can fall”. These conditions still exist.
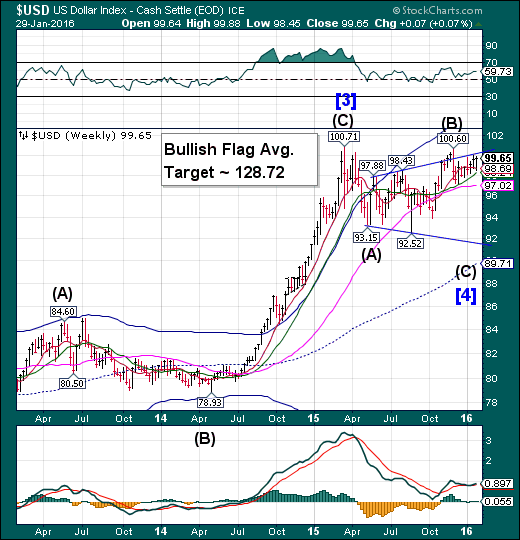
The US dollar rallied, but fell short of the upper trendline of its Broadening Flag formation. A failure to better the December 3 high suggests that the moves of the last seven weeks were a retracement. The Cycles Model calls for the retracement to resume its decline to trendline support near 92.00, once Long-term support at 97.02 is broken. A new Master Cycle low targeted for late February may bring USD down substantially lower. Bullish speculators may be caught the wrong way in their positions, causing a panic among the longs as this decline has the potential of wiping out all 2015 gains.
(MarketWatch) The dollar soared against the yen Friday after the Bank of Japan shocked investors by cutting its deposit rate into negative territory—posting its largest daily gain against the Japanese currency since Oct. 31, 2014.
That date is significant for the BOJ; it was the day the central bank announced an unexpected expansion of its massive program of asset purchases as the Japanese economy struggled with the added pressure from recent tax hikes.
USB extends its rally.
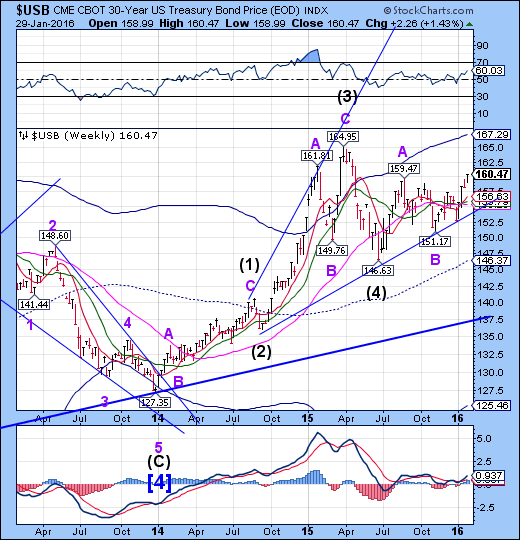
The Long Bond continued its cyclical uptrend from a brief setback last Friday. The next two weeks show that the rally may gain strength. USB appears to be capable of rallying to its Cycle Top resistance currently at 167.29.
(NASDAQ) U.S. government bond yields fell on Friday after the Bank of Japan surprised markets with an interest-rate cut, luring investors into government bonds that pay higher yields.
The benchmark 10-year Treasury note yield fell to 1.928%, from 1.98% on Thursday. This was the lowest yield since April 27, based on 3 p.m. yields. Bond yields fall when prices climb.
Gold probes toward Long-term resistance.
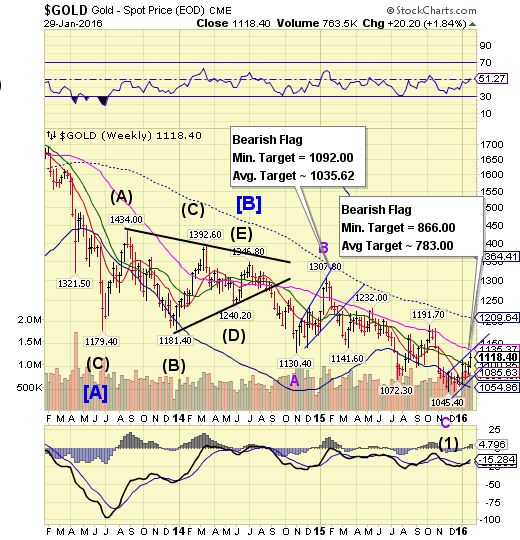
Gold probed to 1128.00, just shy of its Long-term resistance at 1135.37. The rally may be complete, despite the miss. The Cycles Model suggests a probable turn on Monday, whether it touches resistance or not. The decline may quickly resume to its next bearish target.
(Reuters) Gold edged higher on Friday after U.S. data showed economic growth braked sharply in the fourth quarter and the price of the precious metal was on track for its biggest monthly rise in a year after global economic headwinds hit riskier assets.
The metal has risen more than 5 percent in January, underpinned by concerns over the world's growth outlook, especially China, which has raised questions about the pace of interest rate rises in the United States.
"Maybe things won't be this bad next month in the wider markets, so it is possible that if ETF flows are subsiding, prices will be lower too," Macquarie analyst Matthew Turner said.
Crude challenges the neckline.
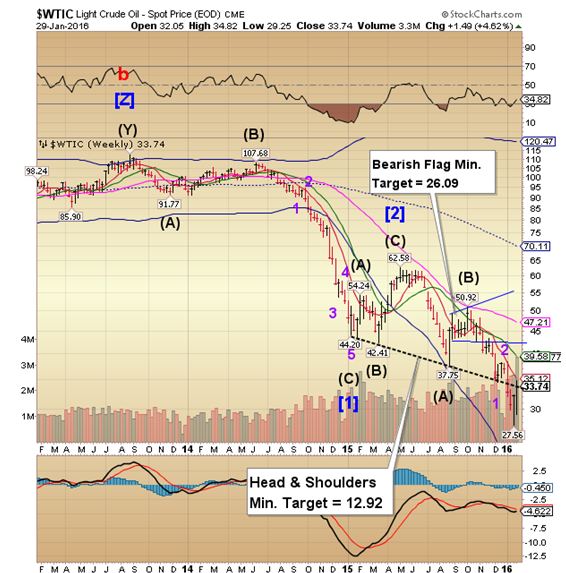
Crude bounced higher to challenge its Head & shoulders neckline and weekly short-term resistance at 35.12. Having reached its target, it may now resume its decline. The Head & Shoulders formation continues to be active and bearish despite the 26% rally. The Cycle Bottom Support continues to fall away at 19.75, supporting this view.
(CNBC) Oil prices rose on Friday, rebounding more than 25 percent from 12-year lows hit last week and cutting losses for the month, on prospects of a deal between major exporters to cut production and curb one of the biggest supply gluts in history.
Oil also drew support from weak U.S. GDP data that raised hopes the Federal Reserve may slow any planned interest rate hikes. The oil market rallied for four straight sessions this week after the Organization of the Petroleum Exporting Countries renewed calls for rival producers to cut supply alongside its members that triggered a volley of comments from Russia on a deal with OPEC, something it had been refusing to do for 15 years.
Shanghai Index leads the world…down.
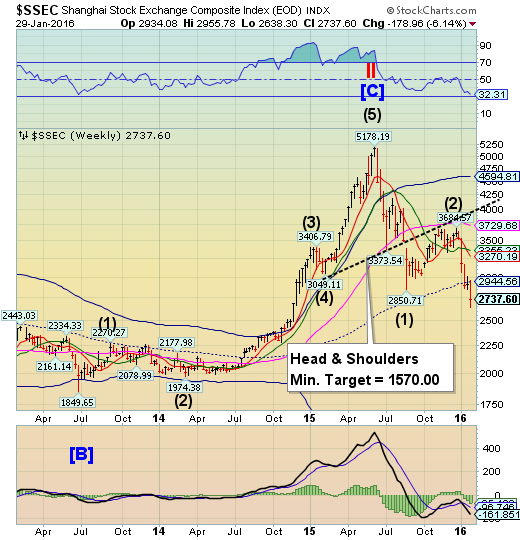
The Shanghai Composite continued its decline to new lows not seen since November, 2014. It made an unusually shallow retracement after its Cycle low on Monday, January 18. The bounce did not last a week. There appears to be continued weakness through the first two weeks of February
(ZeroHedge) Make no mistake, investors didn’t need any more reasons to be bearish on Chinese equities.
Mainland markets are veritable casinos dominated by retail investors who until last summer, were enthralled with the prospect of easy riches in an environment where shares only seemed to know one direction: up.
All of that changed last June when a dramatic unwind in the half dozen backdoor margin lending channels that helped to fuel the rally triggered an epic rout that became self-fulfilling once the retail crowd (which accounts for 80% of the market) became rip sellers rather than dip buyers.
The Banking Index makes a minimal bounce.
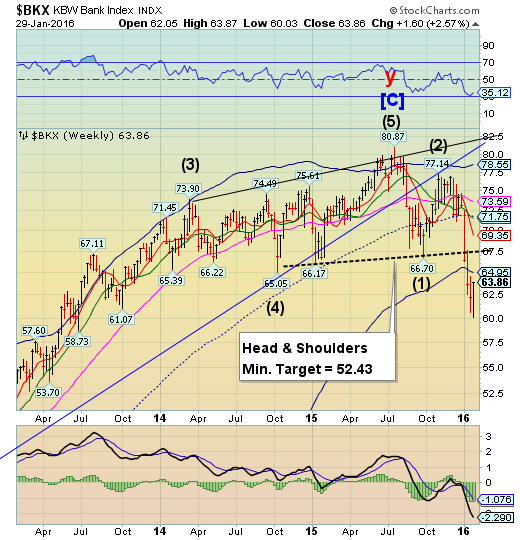
BKX made a new low on Monday, then executed a 26% retracement. A brief bounce back to the Cycle Bottom at 64.95 is not out of the question, but the decline is due to resume imminently. The Cycles Model shows a probable significant low the second week of February. Remember, BKX is a leading index.
(CNBC) 016 is proving a difficult year for banks across Europe, as the industry grapples with nonperforming loans, rocky markets, increasing regulation and exposure to emerging market volatility.
"We start 2016 with a cautious outlook on European banks despite the sector trading at market lows," Bernstein analysts led by Thomas Seidl said in a report this month.
"We downgrade our last year's positive outlook due to a slower-than-expected European recovery despite QE (quantitative easing), margin compression, and the unexpected fall and continuing low oil price with its effect on our emerging markets Brazil, Mexico and Russia," they said.
(ZeroHedge) Last week, we noted that Italy is rushing to defuse a €200 billion time bomb in the country’s banking sector as investors fret over banks’ exposure to souring loans.
“Italian banks’ share prices have been volatile YTD, given the market’s renewed fears over asset quality and potential developments on a possible bad bank creation,” Citi wrote, in a note analyzing which Italian banks are most exposed. “Total gross NPLs in Italy have increased by c160% since 2009 and now represents c18% of loans (vs c8% in 2009).”
(ZeroHedge) As we noted earlier, in a paradoxical U-turn, one which caught everyone by surprise as a result of Kuroda's own promise just one week ago not to engage in NIRP...
... and two months after the ECB's December 3 disappointing announcement led to a historic surge in the EUR, today countless macro hedge funds have been left reeling with huge losses once again, as many had recently turned bullish on the yen...
... only to be eviscerated by the BOJ's negative rates announcement.
(ZeroHedge) “These are extremely poor results,” Citi’s Andrew Coombs wrote last week after Deutsche Bank (DE:DBKGn) CEO John Cryan announced a “sobering” set of numbers for 2015.
By “sobering,” Cryan meant a net loss of more than $7 billion. It was the first annual loss since the crisis and was capped off by a Q4 loss of €2.1 billion which included €1.2 billion in litigation fees.
Revenues missed estimates by 11% and fell 16% Y/Y but that in and of itself “fails to explain €0.7bn of the underlying miss,” Citi’s Coombs continued, ”It would appear that the bank has also been forced to book elevated credit losses during the quarter.”
