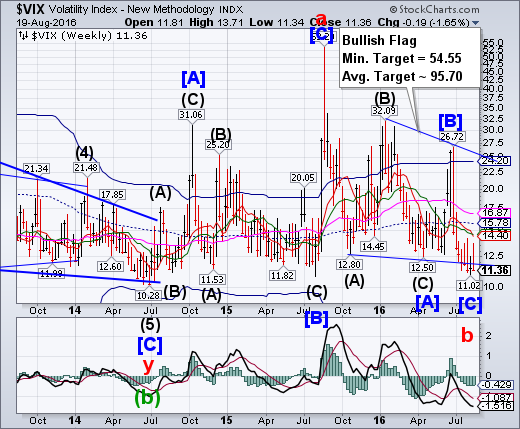
VIX remained above its August 9 Master Cycle low this week.VIX may be primed for a breakout.The declining Short-term resistance at 14.40 and the recent high at 14.24 may intersect with VIX next week. The next important milestone is mid-Cycle resistance at 15.78 where a buy signal is made.
(Bloomberg) A Federal Reserve divided on the timing of its next interest-rate increase and data showing an economy growing in fits and starts have done little to shake U.S. equities from a weeks-long torpor that’s left the S&P 500 Index waffling near all-time highs. By one measure, it’s the longest stretch of calm since July 2014, as the Chicago Board Options Exchange Volatility Index, the gauge of stock market volatility known as the VIX, has held below 15 for 32 consecutive days, according to data compiled by Bloomberg.
SPX trades flat this week.
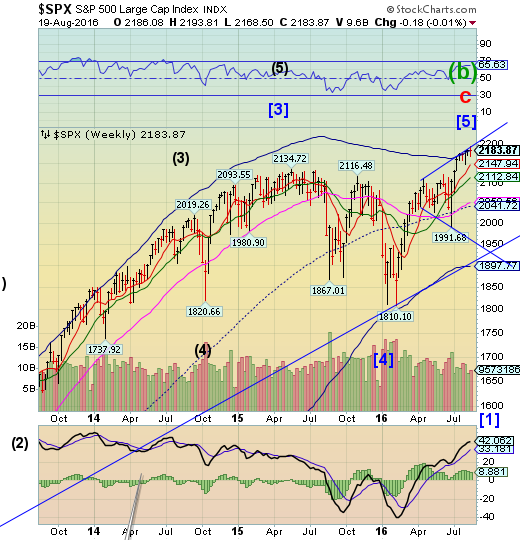
SPX may have made its last challenge of the upper trendline of its Orthodox Broadening Topon Monday. It closed on Friday beneath its Cycle Top support/resistance at 2185.38. SPX has fulfilled all the fractal requirements for a completed uptrend.In fact, the fractal time counterpart to this rally was 183 days. Monday was the 185th day. A significant low is due by the end of the month.
(WSJ) U.S. stocks slipped slightly Friday, as investor expectations rose for a Federal Reserve rate increase later this year.
In a quiet trading session, the Dow Jones Industrial Average fell 45.13 points, or 0.2%, to 18552.57 and the S&P 500 declined 3.15 points, or 0.1%, to 2183.87. The NASDAQ Composite edged down 1.77 points, or less than 0.1%, to 5238.38.
Traders said they expect slow trading sessions and small stock-market moves to continue next week as earnings season has wound down and many desks have emptied due to vacation schedules.
NDX is also flat this week.
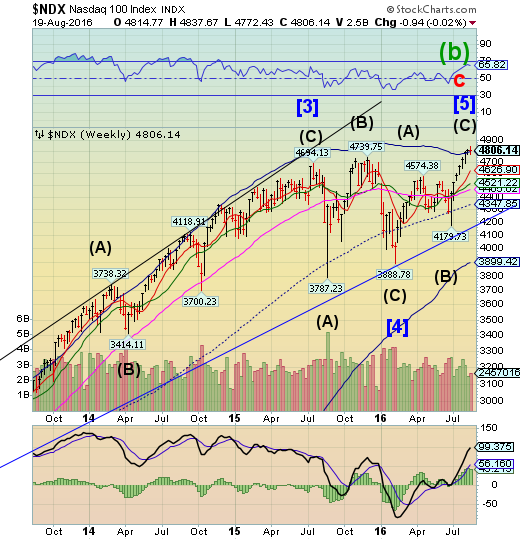
NDX closed above its weekly Cycle Top at 4796.28, but with no gain for the week.It has reached its fractal target of 4732.24 on August 3 and peaked on August 9. A slip beneath the Cycle Top may indicate a reversal is in motion.
The Dow Jones Industrial Average also made a new high on Monday, but closed beneath its Cycle Top support/resistance as well.
(ZeroHedge) Those of you who took an introductory Economics class in high school or college may remember learning that prices are set "at the margin". That's a fancy way to say that prices are set by the person (or people) willing to pay the most.
This person willing to pay top dollar is called the "marginal buyer". Most of us don't really think about him much, but he (or she) is very, very important.
Why? Because the marginal buyer not only determines price levels, but also their stability and degree of volatility. The behavior of the marginal buyer, as well as the degree of competition for his/her "top dog" spot, sets the prices of nearly every asset class held by today's investors
High Yield Bond Index remains range bound.
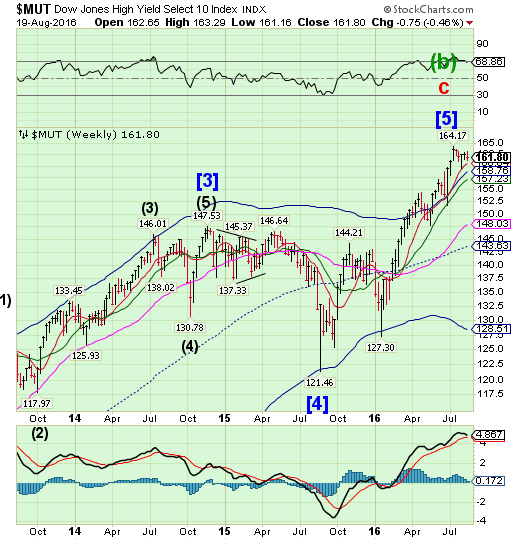
The High Yield Bond Index continued its consolidation in a narrow range this week, closing slightly lower. Investors should now be on the alert for a decline beneath its Short-term support at 160.64 for a probable sell signal. Wall Street is furiously issuing new products as they see the window closing soon.
(ZeroHedge) Just over a month ago, the total number of global defaults hit 100 according to S&P calculations, rising by 50% from the number of bankruptcies at this time last year and the highest level since the financial crisis. By total debt notional, some $154 billion had defaulted as of the mid-point of the year, and extrapolating the trendline revealed something even more troubling: 2016 has a chance of being the year with the most defaults in history, surpassing even the 2009 financial crisis record.
One month later, we learn that another 13 companies have filed for bankruptcy protection, bringing the grand total to 113, matching the number of companies which defaulted globally in all of 2015.
USB declines beneath Short-term support.
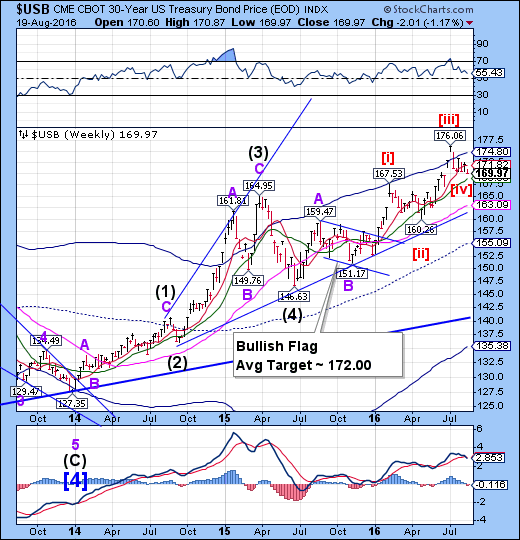
The Long Bond declined beneath Short-term support at 171.82, but still has at least another week of strength before declining into mid-September. A minimum target may be Cycle Top resistance. Should it break through, a potential surge to 185.00 may be indicated. However, it is noteworthy that USB has already fulfilled all of its prior targets.
(MarketRealist) The US Treasury Department held its monthly 30-Year Treasury bonds auction worth $15 billion on August 11, 2016. Overall demand as measured by the bid-to-cover ratio fell by 9.6% to 2.3x compared to the previous auction.
The 30-Year Treasury bonds auction is closely watched by stock and bond (iShares Core US Aggregate Bond (NYSE:AGG)) investors, as long-term Treasury yields (iShares 20+ Year Treasury Bond (NYSE:TLT)) reflect economic growth and inflation expectations. Treasury yields fell following the auction.
The Euro emerges above Intermediate-term support.
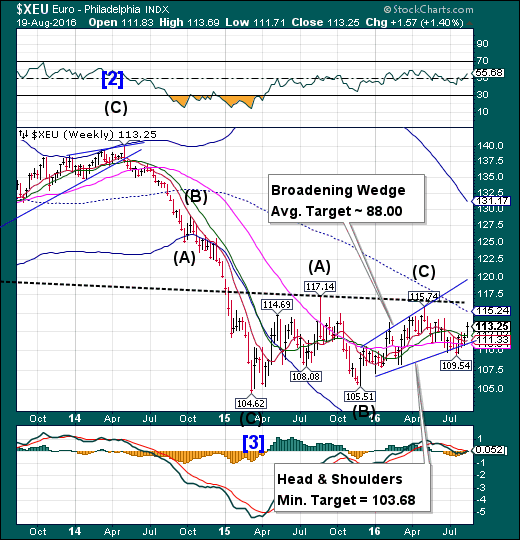
The Euro emerged above Intermediate-term resistance at 112.02 as it completes the right shoulder of a potential Head & Shoulders formation. The Cycles Model suggests an abrupt and very strong decline may be just ahead. In other words, this may be a false breakout.
(FT) The euro is enjoying its best run in three months, bouncing back to hit post-Brexit vote highs this week.
It is currently trading 0.3 per cent down on the day against the dollar at $1.13 but most signals point towards further resilience.
Having strengthened for five straight sessions before today, the single currency could even hit $1.16 against the dollar by the end of the year, says Daniel Waldman at UBS.
Euro Stoxx 50 rallies to Long-term resistance, then declines.
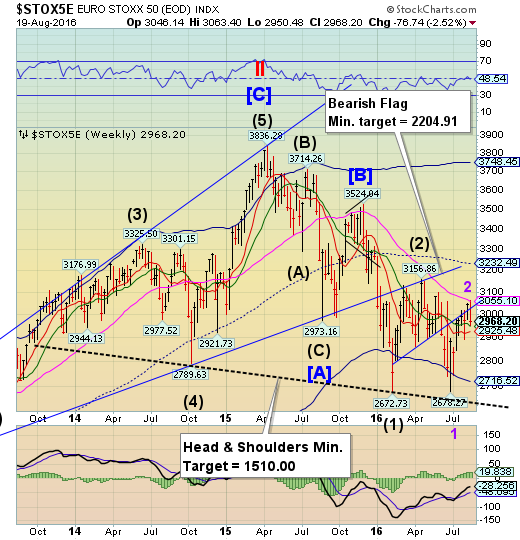
The Euro Stoxx 50 Index rallied to challenge Long-term resistance at 3055.10 on Monday before reversing direction.The Cycles Model identifies this as an inverted Trading Cycle, or a probable false flag, to get more investors hooked before the sell-off.A significant low is due by the end of the month.
(Bloomberg) European stocks posted their biggest weekly slide since the run-up to the Brexit referendum on speculation the recent rebound might have been overdone.
In a broad-based selloff, the Stoxx Europe 600 Index resumed declines after a brief respite on Thursday. Concern over the health of Italian lenders and an upcoming referendum in the country that may lead to the resignation of its prime minister dragged the FTSE MIB down the most among western-European markets. A gauge of miners fell the most in a month as commodities sank amid a rebound in the dollar.
The Yen breaks above the Cycle Top.
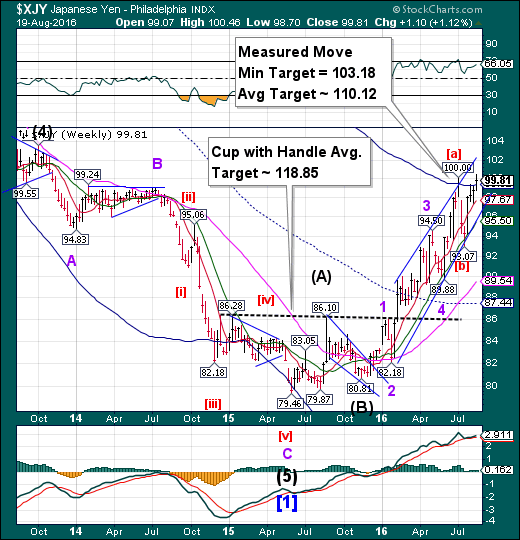
The Yen broke above the weekly Cycle Top support/resistance at 99.32 this week.It also broke out above its prior high at 100.00. The probable new period of strength may last through late September, giving it plenty of time to attempt to make its Cup with Handle target.
(Bloomberg) Any lull in the yen’s rally past 100 per dollar is being seen as a buying opportunity for Japanese investors who say the developed world’s strongest currency this year will stay supported until the Federal Reserve resumes raising interest rates.
The yen touched a seven-week high of 99.54 on Aug. 16 only to end the day at 100.31 amid speculation its strength would add pressure on the Bank of Japan and the government to help stem the advance. On Thursday, the currency rallied to 99.65 before retreating back to as low as 100.50. It was at 100.41 as of 1:15 p.m. in Tokyo on Friday.
The Nikkei 225 reversed down.
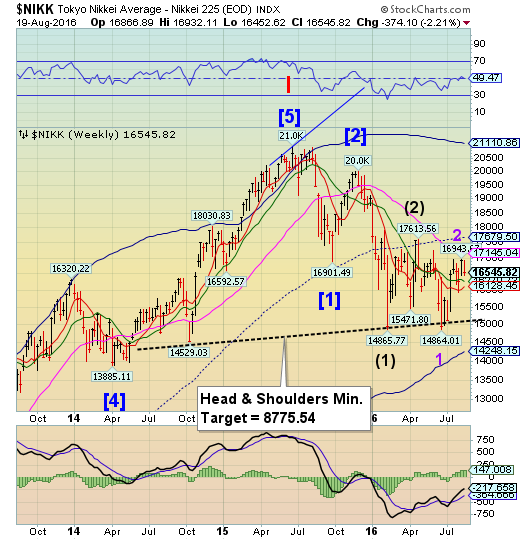
The Nikkei reversed down from last week’s high which failed to challenge Long-term resistance.A decline to the Head & Shoulders neckline may be imminent, as the next Cycle low appears to be due by the end of August. The second “right shoulder” reinforces the potential decline and its target.
(Reuters) Japan's Nikkei share average edged higher on Friday as the strong yen trend paused, soothing investors, but gains were limited as many stayed cautious before next week's global meeting of central bankers.
The Nikkei rose 0.4 percent to 16,545.82. For the week, the benchmark index fell 2.2 percent, as investors rushed to the exit when the dollar dropped below 100 yen this week.
Investors will be looking for clues about a U.S. rate hike at an annual meeting of central bank chiefs in Jackson Hole, Wyoming, next week.
US Dollar Index slips beneath Intermediate-term support.
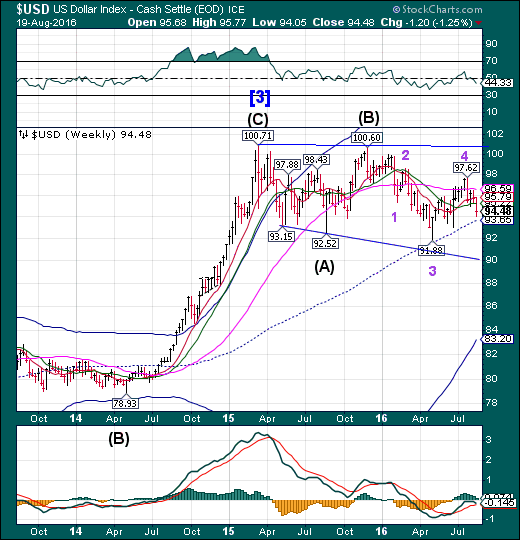
USD declined beneath Intermediate-term support at 95.22. The Cycles Model suggests that the decline may continue into early next week before a significant bounce.It appears that the weekly mid-Cycle support at 93.65 may play an important role in forming the next low. With Jackson Hole coming at the end of the week, USD may be becalmed until the main event (Yellen’s speech) on Friday.
(Investing) The U.S. Dollar Index rallied on Friday from near two-month lows from the previous session, as investors digested a fresh batch of comments from key Federal Reserve policymakers on the possibility of a near-term interest rate hike by the U.S. central bank.
The index, which measures the strength of the greenback versus a basket of six other major currencies, rose as much as 0.40% on Friday before ending the U.S. afternoon session at 94.48, up 0.0029 on the day. With the sharp gains, the index is on pace to end a five-day losing streak. The index has plummeted more than 2.15% over the last month and has fallen by more than 4.3% since the start of the year.
Gold tests short-term support.
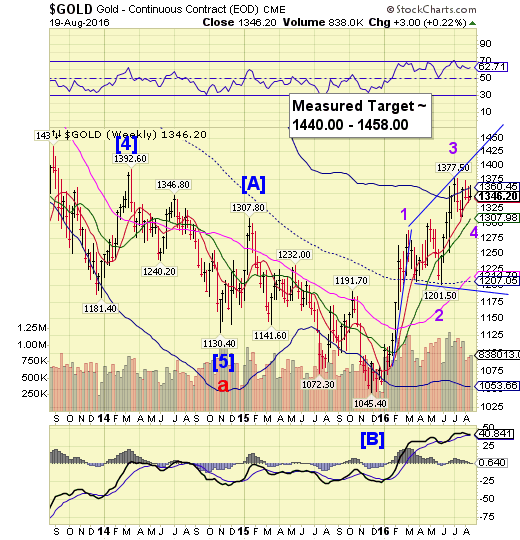
Gold challenged Short-term support at 1342.69 on Wednesday, creating a new Master Cycle low. It retested support today, closing above it.The Cycles Model now projects a period of strength through mid-September. A Triangle formation (daily chart) suggests a minimum rally to 1410.00.
(Bloomberg) The split among Federal Reserve officials on whether to boost U.S. borrowing costs is whipsawing gold again.
Futures gained Thursday, a day after the July Fed minutes were released showing policy makers are divided on rates, only to swing to a loss Friday. Comments from Fed Bank of San Francisco President John Williams after gold futures closed on Thursday revived the bearish sentiment on the precious metal, paring this week’s gains.
Crude‘s rally poses a puzzle.
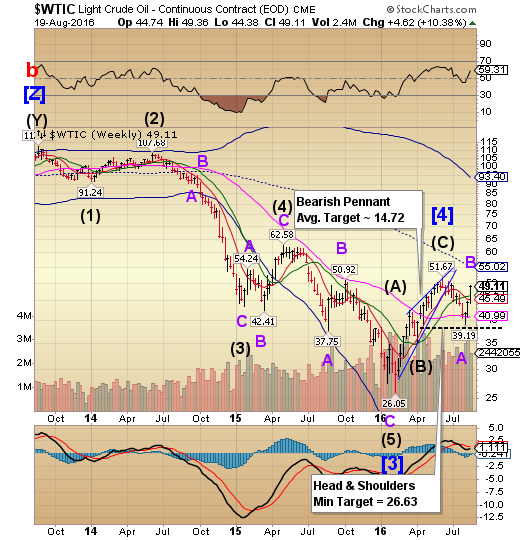
Crude’s 26% rally from the August 2 low poses a dilemma. This ramp has the earmarks of a false move, since the August 2 low was a probable Trading Cycle low that usually engenders bounces at 10% or less. What this means is that the Master Cycle low may not be in, yet. It indicates that the potential decline may surpass the February 11 low at 26.05 in the next two weeks. The alternate view also calls for a decline, but not as dramatic.
(OilPrice) s we truck on into the weekend, oil has turned lower after six consecutive days of rallying. (Only another 5.5 weeks until potential freeze talks in Algeria...). Later we get the latest CFTC data to see how emphatic short-covering has been, but for now - hark, here are five things to consider in oil markets today:
1) North Sea oil output is set to reach a 2-year low next month, as Buzzard, the largest oil field in the UK North Sea - and linked to the Forties crude stream - is set to undergo maintenance for a month, starting in mid-September.
As our Clipper Data illustrates below, crude oil loadings of Forties have gradually ticked lower throughout this year. After recent refinery strikes and impending maintenance, loadings are set to continue on this trajectory into the fall (err, autumn).
Shanghai Composite probes toward mid-Cycle resistance.
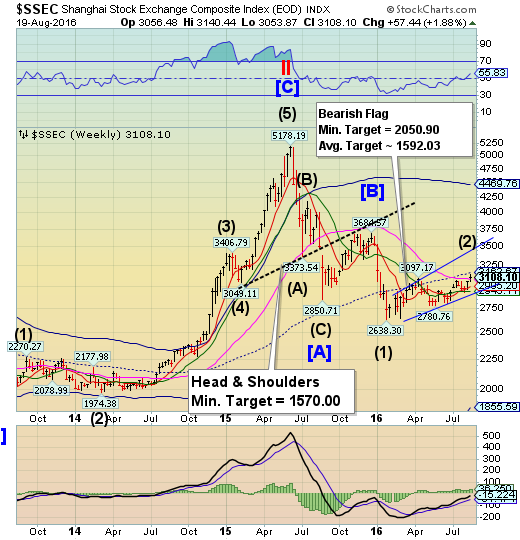
The Shanghai Index probed toward mid-Cycle resistance at 3162.67, but turned back on Tuesday without making its target. The period of strength indicated by the Cycles Model ended early. The first installment in the coming decline may be short in duration, but strong.Following the bounce, there may be an extended decline through mid-October.
(Xinhua) -- Despite opening lower on Friday morning, Chinese stocks regained some ground during the afternoon session helped by a strong rebound by companies related to the Belt and Road initiative.
Major indices were mixed. The benchmark Shanghai Composite Index increased 0.13 percent to close at 3,108.1 points, but the Shenzhen index closed 0.06 percent lower at 10,872.71 points.
The ChiNext Index, the NASDAQ-style board of growth enterprises, was up 0.13 percent to close at 2,204.56 points.
The KBW Bank fails its attempt at mid-Cycle resistance.
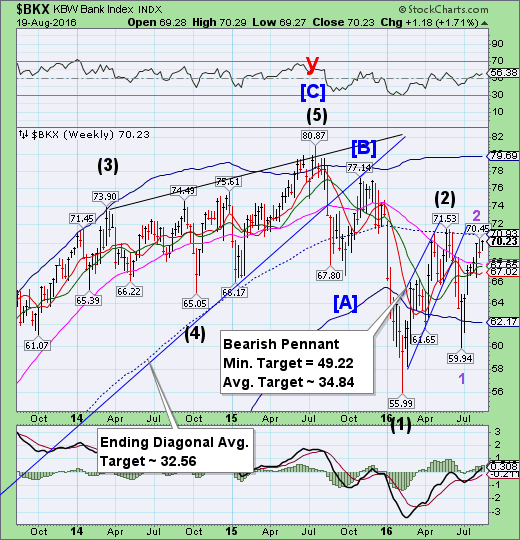
--BKX failed in its effort to challenge mid-Cycle resistance at 70.93 for a second week.The Cycles Model calls for a Master Cycle low due on or near the end of the month.That low may be at or near the Bearish Pennant minimum target.
(CNBC) European Union banks just can't catch a break.
Many of them are still slogging uphill to recoup share price losses incurred from the Brexit vote in the U.K. European investment banking revenue overall is down 23 percent this year compared with the same period in 2015, according to data tracker Dealogic. And all are lagging behind U.S. banks for wallet share, or how much revenue they take in from deal making compared to competitors.
(ZeroHedge) Last weekend, when we reported that Germany's Raiffeisenbank Gmund am Tegernsee - a community bank in southern Germany - said it would start charging retail clients a fee of 0.4% on deposits of more than €100,000 we said that "now that a German banks has finally breached the retail depositor NIRP barrier, expect many more banks to follow."
Not even a week later, not one but two large banks have done just that.
(ZeroHedge) At the height of the financial crisis, when risk assets were imploding and counterparties were in danger of overnight collapse, Deutsche Bank (DE:DBKGn) avoided failure and nationalization by fabricating the value of its $130 billion derivative portfolio of "leveraged super senior" trades.
Some history: back in 2005, these trades were seen as "the next big thing" in the world of credit derivatives, something which DB at the time was building a massive position in. They were designed to behave like the most senior tranche of a typical collateralised debt obligation, where assets such as mortgages or credit default swaps are pooled to give investors varying degrees of risk exposure. Deutsche became the biggest operator in this market, which involved banks buying insurance against the possibility of default by some of the safest companies, the FT writes.
There was just one problem: when it was building up its portfolio, Deutsche never accounted for the possibility of the financial world nearly collapsing. Which is why as the illiquid portfolio was careening, instead marking it to market - an act that would have resulted in the bank's insolvency - DB's risk managers misstated the value of the positions by anywhere from $1.5bn to $3.3bn.
(ZeroHedge) Under guise of preventing fraud the ECB voted to kill the €500 note.
Fraud was not the real reason. The real reason was to make it more difficult for banks to store physical cash to avoid negative interest penalties... but it's not working.
The idea of keeping piles of cash in high security vaults may sound like something from an old movie plot, but some banks and insurers have recently started considering the idea as interest rates sink below zero across much of Europe.
After the European Central Bank’s most recent rate cut in March, private-sector banks are paying what amounts to an annual levy of 0.4 per cent on most of the funds they keep at the eurozone’s 19 national central banks. This policy, which has cost banks around €2.64bn since ECB rates became negative in 2014, is intended to spark economic growth by giving banks the incentive to lend money out to businesses instead of holding on to it.
European central bankers say they could cut rates again should economic conditions worsen, but private bankers and insurers are already thinking of creative ways to avoid those charges altogether.
