
Index Futures Net Changes and Settlements:

Foreign Markets, Fair Value and Volume:
- In Asia 7 out of 11 markets closed lower: Shanghai Comp +0.40%, Hang Seng -0.01%, Nikkei -0.80%
- In Europe 13 out of 13 markets are trading lower: CAC -0.28%, DAX -0.25%, FTSE -0.93%
- Fair Value: S&P +0.81, NASDAQ +4.56, Dow +17.71
- Total Volume: 1.62mil ESU & 453 SPU traded in the pit
Today’s Economic Calendar:
Today’s economic calendar includes the Employment Situation m8:30 AM ET. Eric Rosengren Speaks 8:30 AM ET, Loretta Mester Speaks 9:00 AM ET, Quarterly Services Survey 10:00 AM ET, Eric Rosengren speaks on Saturday 10:45 AM ET, the Baker-Hughes Rig Count 1:00 PM ET, Robert Kaplan Speaks 1:20 PM ET, and Treasury STRIPS 3:00 PM ET.
S&P 500 Futures: Nasdaq Down Three In A Row Or Down Four Of The Last Five Sessions

If you want to know where the stock market is going it all comes down to five stocks… FAANG. It used to be things like the Dow Transports or key economic indicators, but today it’s all about tech stocks. The other thing scaring investors is the $200 billion in Chinese tariffs that keep weighing on the markets, but my feeling is that tech stocks top the list of importance.
Yesterday the S&P 500 futures sold off for the third day in a row. The ES globex range was 2882.00 to 2892.50, and the first print off the 8:30 futures open was 2889.75. After the open the ES traded up to an early high at 2893.75 before 9:00 sell programs took it for a ride lower, making the low of day at 2869.00 around 10:30. From there the ES bounced up to 2878.75 before retesting the low and printing 2868.00 just after noon, and then rallied up to 2884.50. The futures went on to print 2880.25 on the 3:00 close, and settled the day at 2879.00, down -9.25 handles, or -0.32%.
In the end, it’s all about the tech stocks… where they go goes the markets.
Stock Traders Almanac – September Performance
Thus far solid market gains in August have not exactly carried over into September. DJIA is a slightly higher, but S&P 500 and NASDAQ are not. Looking back at past strong August performance there is a pattern of below average performance in September. The dividing line for “strong” August performance was drawn at each index’s respective performance this August. For example, any August since 1950 in which DJIA gained 2.2% or more was included. The same dividing line was used for S&P 500 going back to 1950 and NASDAQ since 1971.
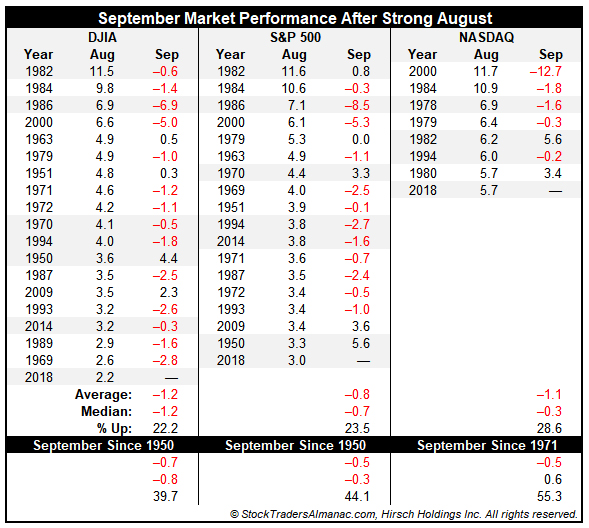
Looking at the above table, September’s weaker performance following a “strong” August is quite visible. Compared to all Septembers since 1950, DJIA average performance following a “strong” August falls to a 1.2% loss compared to a 0.7% average decline in all Septembers. The frequency of positive Septembers also declines significantly from 39.7% in all Septembers to just 22.2% in Septembers after a “strong” August. S&P 500 and NASDAQ exhibit similar declines in September’s average performance. In the case of a “strong” August, strength does not equal continued strength all that often.
Disclaimer: Trading Futures, Options on Futures, and retail off-exchange foreign currency transactions involves substantial risk of loss and is not suitable for all investors. You should carefully consider whether trading is suitable for you in light of your circumstances, knowledge, and financial resources. Any decision to purchase or sell as a result of the opinions expressed in the forum will be the full responsibility of the person(s) authorizing such transaction(s). BE ADVISED TO ALWAYS USE PROTECTIVE STOP LOSSES AND ALLOW FOR SLIPPAGE TO MANAGE YOUR TRADE(S) AS AN INVESTOR COULD LOSE ALL OR MORE THAN THEIR INITIAL INVESTMENT. PAST PERFORMANCE IS NOT INDICATIVE OF FUTURE RESULTS.