
EU indices closed in positive territory yesterday, but the gains were kept limited as bank shares fell following a warning of “significant” losses after US-based hedge fund Archegos defaulted on margin calls.
The news weighed on US shares, but market sentiment improved during the Asian session today, despite US Treasury yields climbing higher. It seems that investors have taken the news in stride, and instead resumed increasing their risk exposures.
Banks Hit By Fund Default, But Broader Appetite Stays Supported
The US dollar traded mixed against the other G10 currencies on Monday and during the Asian session Tuesday. It gained versus JPY, SEK and EUR in that order, while it underperformed versus NOK, NZD, AUD, and CAD. The greenback was found virtually unchanged against CHF and GBP.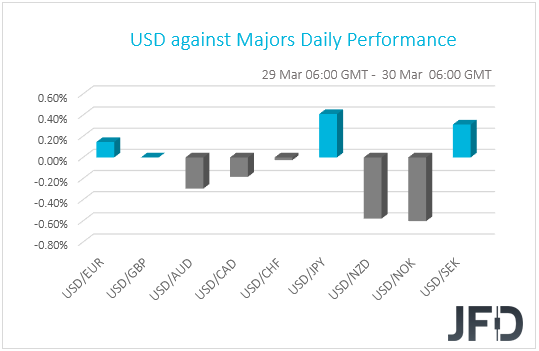
The weakening of the safe-haven yen, combined with the strengthening of the risk-linked Aussie and Kiwi, as well as the strengthening of the oil-linked Krone and Loonie, suggests that markets traded in a risk-on manner yesterday and today in Asia.
Turning our gaze to the equity world, we see that most major EU indices traded in the green, with the exceptions being Spain’s IBEX 35 and UK’s FTSE 100. In the US, only the Dow Jones closed positive, with both the S&P 500 and NASDAQ sliding 0.09% and 0.60% respectively. Market sentiment improved again during the Asian session today, with Japan’s Nikkei 225 and China’s Shanghai Composite gaining 0.11% and 0.35% respectively.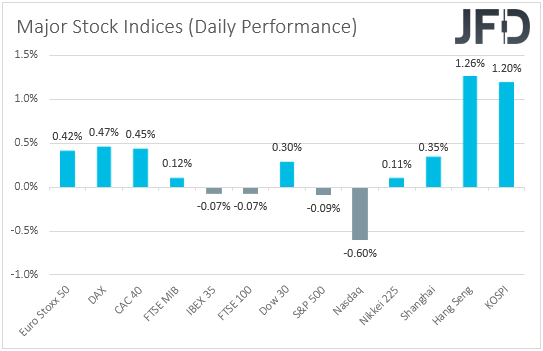
Although most EU indices closed in positive territory, the gains were kept limited as bank shares fell following a warning of “significant” losses after US-based hedge fund Archegos defaulted on margin calls. Credit Suisse (SIX:CSGN) slumped 13.8% and said that while it was “prematurely to quantify” the resulting loss, “it could be highly significant and material to our first quarter results”. The news weighed on US shares, but market sentiment improved during the Asian session today, despite US Treasury yields climbing higher.
It seems that market participants did not panic from the rising yields this time around, as they may have started digesting the idea that this just represents a robust economic recovery, and that the US economy is unlikely to run too hot. Remember that we have noted several times in the past that inflation fears could ease, something that could allow equities and other risk-linked assets to trend north.
We based our view on the Fed’s stance that any spike in inflation in the months to come is likely to prove to be temporary, and that they expect inflation to meet their goal in the years after 2023. What’s more, at the press conference following the latest FOMC meeting, Fed Chair Powell noted that it is too early to discuss tapering QE, while the dot plot pointed to no rate hikes even in 2023.
Market participants have taken the developments with regards to the Archegos fund in stride for now, and if the news dissipate soon, we would expect them to continue increasing their risk-exposure, and perhaps even at a faster pace. In the FX sphere, we believe that that currency pairs that may perform well may be those consisting of one risk-linked currency and a safe haven, the likes of AUD/JPY and NZD/JPY.
S&P 500 Technical Outlook
As the S&P 500 continues to trade above a short-term upside support line taken from the low of Mar. 4, the index quietly approached the area near its all-time high, at 3989. The index is still running above all of our EMAs on our 4-hour chart and the RSI with the MACD are showing positive price momentum. For now, we will take a positive approach.
If the index struggles to overcome its key resistance area straight away, which is between the 3943 and 3989 levels, marked by yesterday’s high and the all-time high, this could result in a slight decline, possibly bringing the S&P 500 to yesterday’s low, at 3939. If that zone provides good support, the price may rebound and make its way higher. If the bulls have enough energy to overcome the above-mentioned resistance area, this will confirm a forthcoming higher high and place the index into the uncharted territory.
In order to shift our attention to some lower areas, a break of the aforementioned upside line and a drop below the 3888 hurdle, marked by the low of Mar. 24, would be required. Such a move could open the way towards the low of last week, at 3852, a break of which would confirm a forthcoming lower low, possibly sending the S&P 500 to the 3798 level, marked by the low of Mar. 8.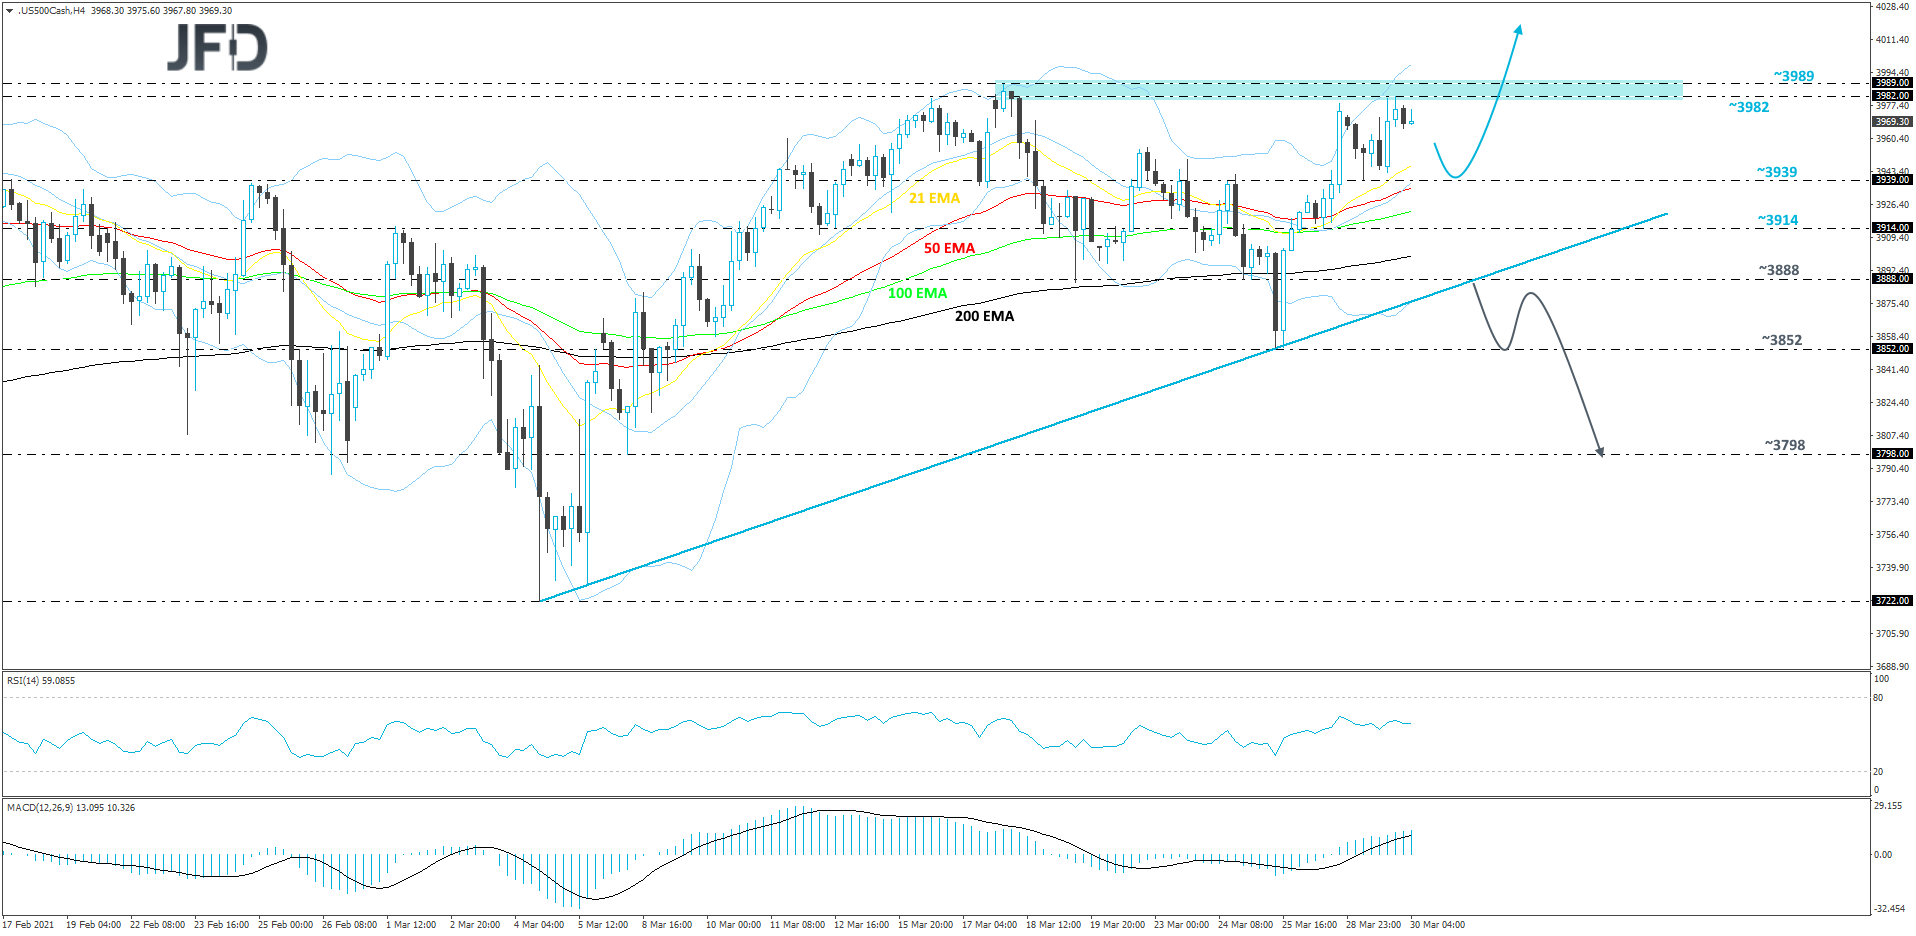
AUD/JPY Technical Outlook
Last week, after finding support near the 82.28 hurdle, AUD/JPY reversed back up and is now trading above all of its EMAs on our 4-hour chart again. Also, the pair is balancing above a short-term tentative upside support line taken from the low of Mar. 25. As long as that upside line stays intact, we will continue aiming higher.
A small push north could bring the rate to the 84.37 hurdle, marked by the high of Mar. 23, where the pair might stall for a bit, or even retrace back down. That said, if the aforementioned upside line continues to hold, the bulls may take advantage of the lower rate and push up again. If this time the buyers are able to overcome the 84.37 obstacle, they could aim for the 84.73 hurdle, or the 85.08 level, marked by an intraday swing low of Mar. 18.
On the downside, if the aforementioned upside line breaks and the rate falls below the 83.33 zone, marked by the low of Mar. 29, that could attract more sellers into the game, possibly clearing the path to some lower areas. AUD/JPY may then drift to the 83.06 obstacle, or to the 82.55 hurdle, which is the low of Mar. 25. If the slide continues, the next possible target might be at 82.28, marked by the current lowest point of March.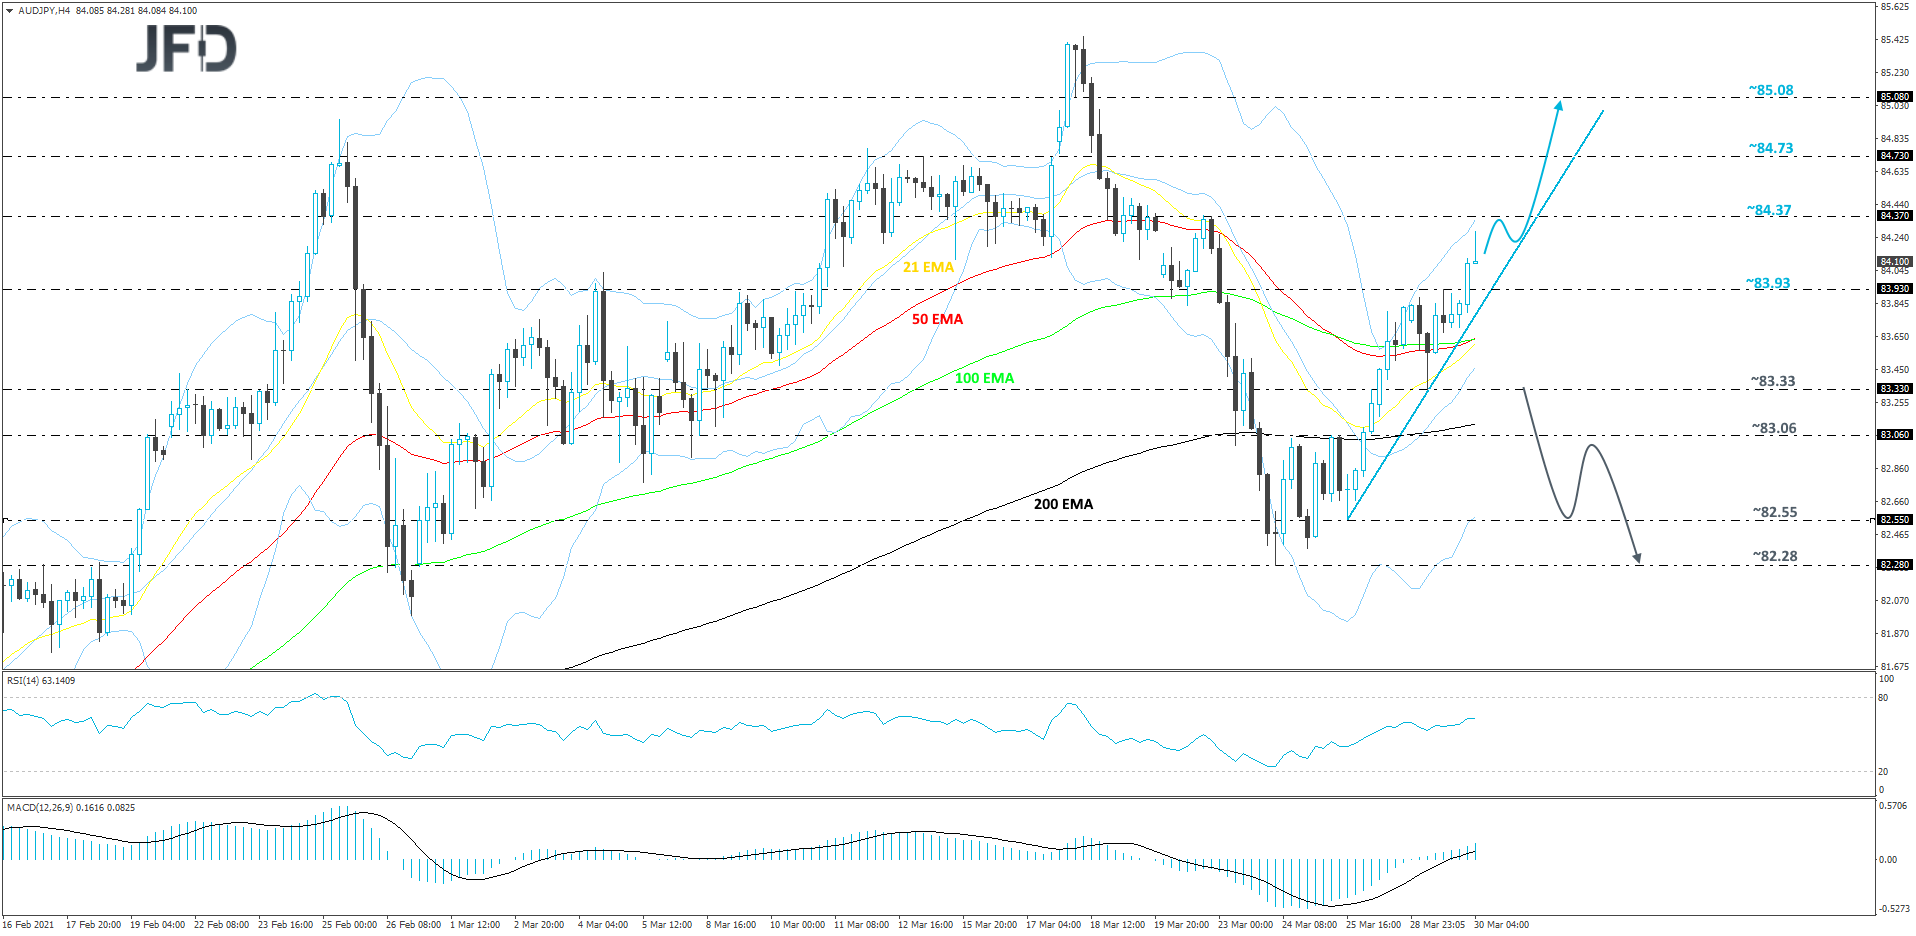
As For Today's Events
During the European session, Germany’s preliminary inflation data for March is coming out. Both the CPI and HICP rates are forecast to have increased to +1.7% yoy and +2.0% yoy, from +1.3% and +1.6% respectively. This is likely to raise speculation that Eurozone’s headline inflation, due out on Wednesday, may also accelerate.
Tonight, during the Asian session Wednesday, Japan’s preliminary industrial production for February is forecast to have fallen 1.2% mom, at a faster pace of decline than January’s -1.0% mom. The official Chinese PMIs for March are also coming out, but no forecast is currently available. The Chinese PMIs have been trending lower recently, and another decline in March may highlight that the world’s second largest economy is not recovering at the desired pace.
As for the speakers, we have two on today’s agenda and those are New York Fed President John Williams and Atlanta Fed President Raphael Bostic