Summary
Three related reports today cover the Dow 30, Nikkei 225, Shanghai Composite, iShares Barclays 20+ Yr Treasury (Long Bonds), the Dollar, Gold, Silver and the latter's volatility premiums.
The conclusion of the precious metals article discusses the most leveraged defined risk long-term trade that I have seen in 32 years, including silver and the major Nikkei, Dow and Shanghai summits.
Coverage of these asset classes, markets and silver volatility premiums, points to a convergence of all price activity in creating that PM inflection point and its related strategy. This report looks at long-term rates, the Dollar and Asia.
LONG BONDS (iShares Barclays 20+ Yr Treasury (ARCA:TLT))
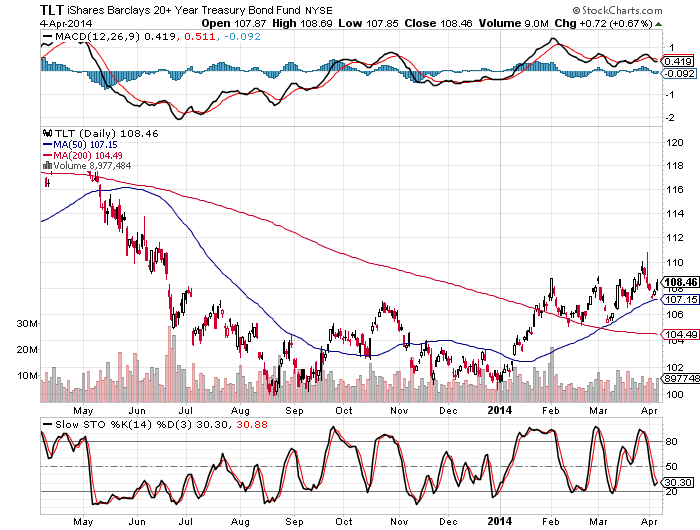
The interpretation here is that wave-1 up from the yearend low completed on the first day of March, while wave-a of the subsequent correction terminated with a triangle formation at mid-March.
I see wave-b as having completed month-end, replete with a bearish slow stochastic divergence and sell signal. (The 1-year graphs include the MACD above the price charts, while the more important slow stochastic appears below them.)
However, with wave-b being nicely higher than wave-1, the conclusion is that wave-c of 2 will hold above 106.
Upshot: A new round of lower long rates nears, even as traders may be fretting about the 20-year bonds' just-commenced decline off of the price high, one that I do not interpret as having been the orthodox peak.
Falling rates is precious metals-positive, as is political upheaval in the Ukraine, though the latter is not a requisite ingredient for the PM bull. Still, no one would be surprised if a Wave-3 liftoff coincided with such an event, since Wave-3 moves are the most powerful.
While the ongoing crisis in the Ukraine has garnered much attention, we can't be sure what the initial reaction would be on long rates and the Dollar.
The technical interpretation of the Dollar below, suggests a smash before a reversal higher.
Meanwhile, as discussed above, the 20-year bonds' chart below suggests to me that a wave-c needs to complete, before the advance higher resumes.
Therefore, these technical interpretations suggest that the first reaction to political strife could include dumping of the Dollar and US assets, followed by a perception that Treasuries provide the requisite liquidity for safe haven seekers.
Since the metals can't provide as much liquidity, it is consistent, therefore, that the PM advance would be strong enough to make investors think about short term value at that point.

DOLLAR
As previous SKGS reports have analyzed, the USD is within a broad expanding triangle.
Points-1, 2, 3 and 4 completed in the May through July period of last year. Point-5 then concluded in October 2013, while point-6 concluded at the end of this past January.
If correct, the upshot would be a swift and deep decline because, by definition, that is what point-7 must necessarily be in an expanding triangle. With a slow stochastic that is rolling over from a very lofty height, one must be on guard for a swift smash at anytime.

NIKKEI
It has been widely covered that the hedge funds have a massive trade to unwind, as Abenomics has proven to be unsuccessful. Deeply underinvested at 8000, these funds are now loaded up due to what became widely known as the easy Yen trade, which has been inversely correlated to the Nikkei.
The spike in sales taxes comes at a terrible time for the economy, which has not been
bailed out by the printing schemes. However, it has led to a massive Japanese run into gold.
It has long-since been commented here that the postal funds' minor exposure to gold led to their signal that they were commencing to invest their trillions of Yen into it. That signal was, in fact, an understatement at the time that they finally took that decision.
I repeat: The Japanese can singlehandedly erupt gold! And they will, if I still know anything about my friends in Japan.
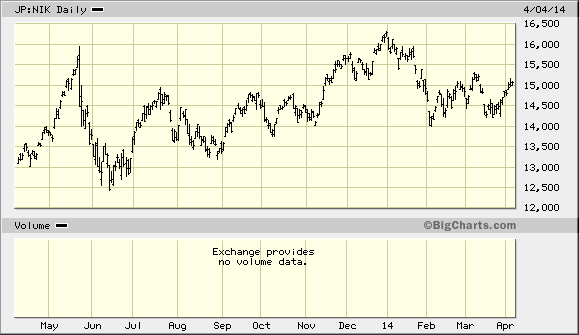
Technically, we are looking at a massive shoulder-head-shoulder formation, with the left shoulder having occurred last May, while the head completed at the end of the year.
As repeatedly noted since 1988, market extremes occur at the West's yearend (due to tax-related activity and window-dressing), while another though less perfect extreme occurs at their own yearend in March.
This March appears to have concluded a wave-2 peak. Watch out!
A break of 14,000, which is also the previous wave-4 (and) apex conclusion, can and should send this index spiralling toward 11,000 FAST.
For the Dow, this represents a massive international equities non-confirmation. It also reminds those not of short memory of the currency frolics at the beginning of the year.
The emerging markets were not something to ignore. In fact, readers throughout the years know my view that major events that are relatively ignored locally, come home to roost, sooner or later. That time is fast approaching, if we are not already there.
Remember too: when traders can't sell what they own, they sell anything. The Dow is joined at the Nikkei hip, in other words.

SHANGHAI
With nothing to add to previous fundamental coverage, this is simply technical:
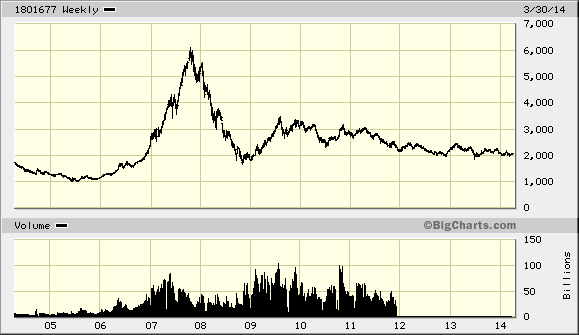
The down-trending wedge formation that began at the beginning of 2010 is set to break down, with support levels at 1500 and 1000.
We are a long way from 6000, and as stretched as it was then, is as grand the negative overshoot will have been.
February 1, 2014
"One thing we do know is this: The 18-year chart immediately above (below) is a mess and looks ready to melt toward 1000 through 2015."
This is the background in China as global financial markets crumble everywhere.

