
Major EU and US indices traded in green territory yesterday, with the upbeat investor morale easing somewhat during the Asian session today. For now, we prefer to stay sidelined, as today’s calendar includes the US initial jobless claims for last week and the ISM non-manufacturing index for May, while tomorrow, we get the US employment report for May. These data sets may reshape market expectations around the Fed’s future actions.
Equity Markets Drift North Ahead Of Tomorrow's Jobs Data
The financial community traded in a risk-on manner yesterday, as major EU and US stock indices traded in the green. The only exception was Spain’s IBEX 35, which slid 0.10%. The appetite eased somewhat today during the Asian session, with Japan’s Nikkei 225 and South Korea’s KOSPI gaining 0.39% and 0.84% respectively, but China’s Shanghai Composite and Hong Kong’s Hang Seng losing 0.10% and 0.72%.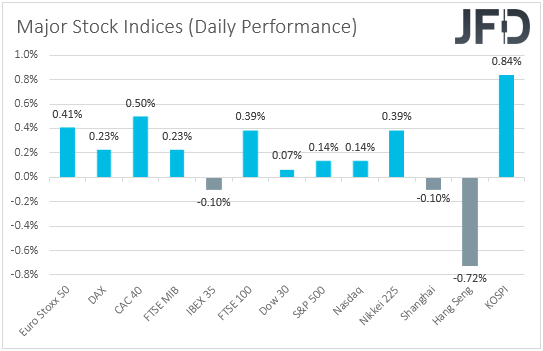
It seems that market participants were a bit more comfortable adding to their risk-exposure a couple of days before the US employment report for May. That said, despite the latest improvement in market sentiment, we prefer to step to the sidelines as, today, ahead of tomorrow’s NFPs, we have the initial jobless claims for last week and the ISM non-manufacturing index for May. Initial jobless claims are expected to continue declining, to 390k from 406k, while the ISM index is anticipated to have increased to 63.0 from 62.7.
With the core PCE index, the Fed’s favorite inflation metric, surging to +3.1% yoy from +1.9%, the ISM manufacturing index climbing to 61.2 from 60.7, and some Fed officials sharing the view that the Committee should start discussing policy normalization at its upcoming meetings, more signs that the economy and the labor market are improving are likely to weigh on equities, especially on high-growth tech firms.
Yesterday, Philadelphia President Patrick Harker joined the group of officials supporting a QE tapering, which means that with more upbeat US data, the chances for policy normalization will increase. Faster QE tapering means interest rates could rise sooner as well, which may raise concerns about the discounted present values of the aforementioned growth stocks as they are mainly valued based on earnings expected years into the future. At the same time, the US dollar is likely to rebound.
That said, for that market reaction to last for a while longer, the US employment report for May, due out tomorrow, may have to come on the strong side as well. Nonfarm payrolls are expected to have accelerated to 650k from 266k, something supported by the forecast of the ADP report, which is scheduled to be released today. However, history has shown that the ADP number is far from a reliable predictor of the NFPs, and perhaps that’s why the market barely responds to it.
In any case, the unemployment rate is expected to have declined to 5.9% from 6.1%, while average hourly earnings are expected to slow to +0.2% mom from +0.7%. Nonetheless, this will drive the yoy rate up to +1.6% yoy from +0.3%, increasing speculation that inflation is likely to continue rising and thereby lead to policy normalization by the Fed.
S&P 500 Technical Outlook
Overall, the S&P 500 continues to trade above a few short-term tentative upside support lines. One, which is closer to the price is taken from the low of May 27, and another one, drawn from the low of May 13, from which the index is currently much further away. In addition to that, the index continues to balance above all of its EMAs on our 4-hour chart, which adds more positivity to the near-term outlook.
We might see the price retracing slightly lower at some point, however, if the upside line, which is drawn from the low of May 27, provides a good hold-up, then the S&P 500 could rebound and make its way higher. The price might overcome yesterday’s high and push towards the current highest point of June, at 4233. If the bulls continue to feel strong, they may see the 4233 area as a temporary obstacle on their way towards the 4244 zone, which is the current all-time high.
Alternatively, if the above-mentioned shorter-term upside line breaks and the price falls below the 4193 hurdle, marked by the current lowest point of June, that may temporarily spook the bulls from the field, allowing more bears to join in. The S&P 500 could then travel to the 4180 obstacle, or to the 4171 zone, marked by an intraday swing high of May 24. If the selling doesn’t stop there, the index may continue sliding, possibly aiming for the 4145 level, marked by the low of May 23. Slightly below it runs the previously mentioned upside line, drawn from the low of May 13, which might provide additional support.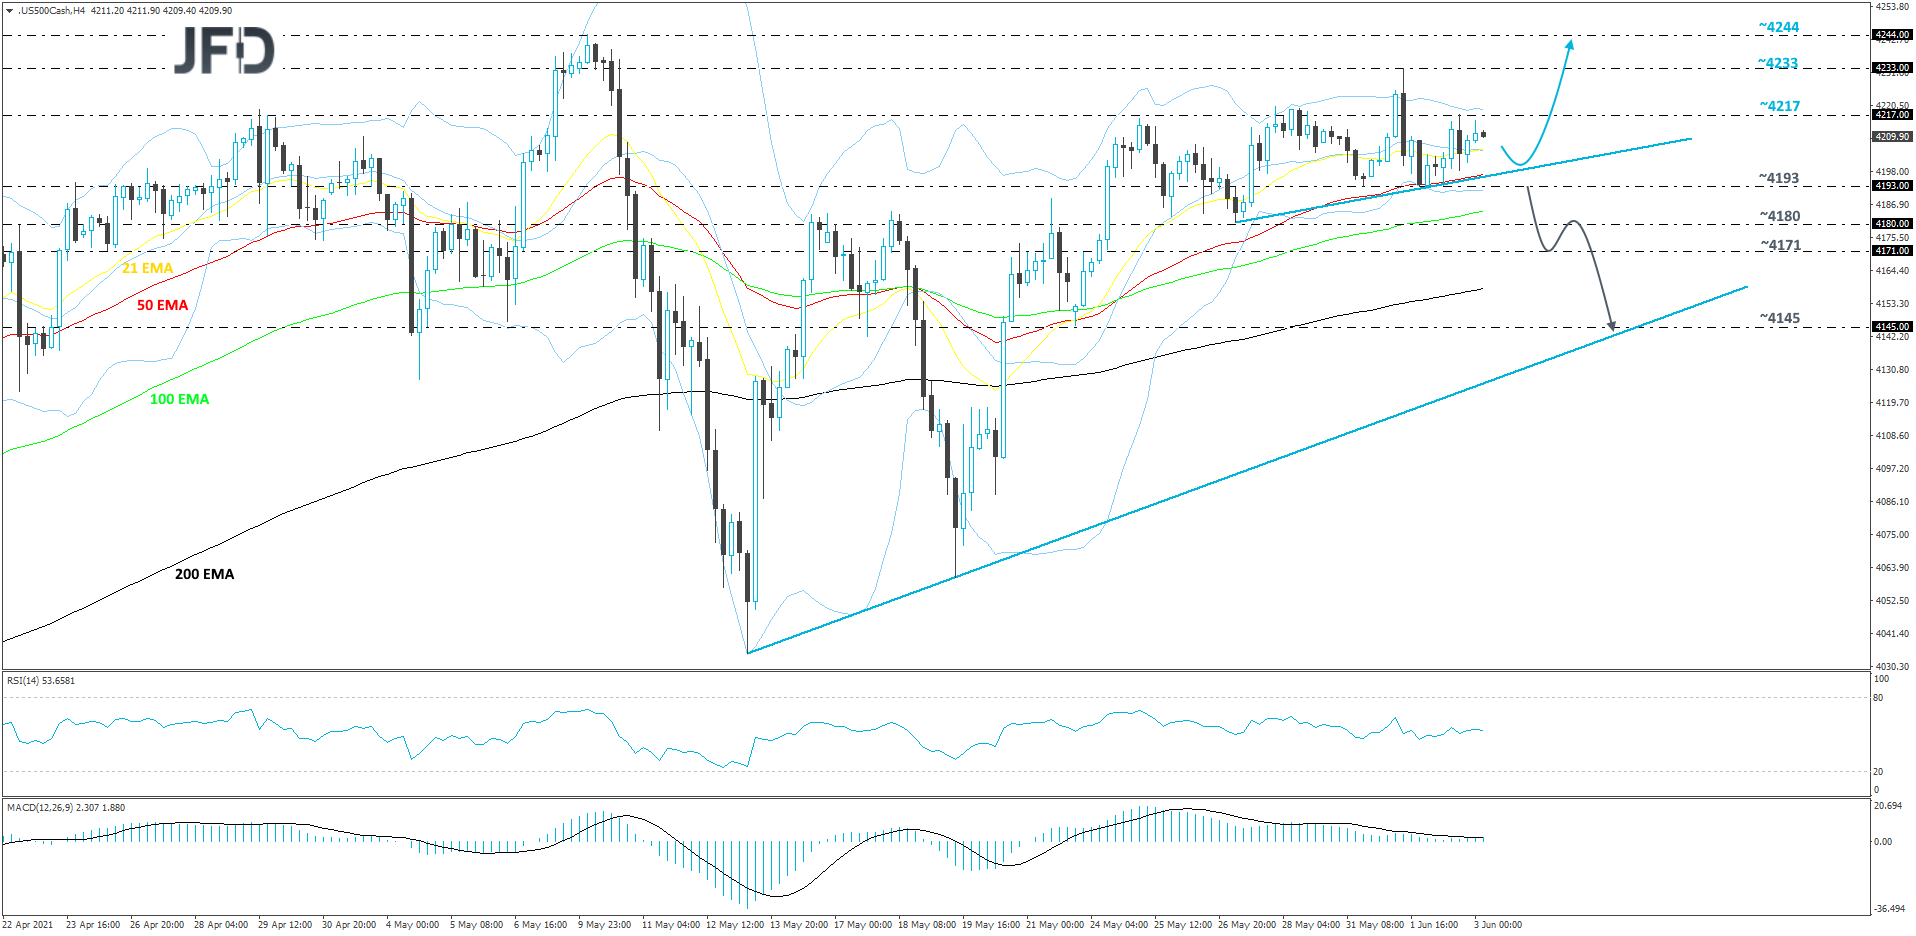
AUD/USD Technical Outlook
AUD/USD seems to be stuck in between two of its short-term tentative lines, an upside one taken from the low May 4, and a downside one drawn from the high of May 18th. In order to consider the next short-term directional move, a break through one of them would be needed. Until then, we will take neutral stance.
If the rate makes its way higher, breaks yesterday’s high and violates the aforementioned downside line, this may attract more buyers into the game, potentially clearing the pathway towards higher areas.
That’s when we will aim for the 0.7795 hurdle, marked by the high of May 26, a break of which could set the stage for a further move north. AUD/USD could then end up testing its next resistance area between the 0.7813 and 0.7820 levels, marked by the high of May 18 and the low of May 11.
Alternatively, if the previously discussed upside line breaks and the rate falls below the 0.7715 zone, marked by yesterday’s low, that might open the door towards lower areas, as the bulls may get spooked temporarily. AUD/USD could then drift to the psychological 0.7700 obstacle, which if broken may lead the pair to the 0.7677 level, marked by the low of May 28.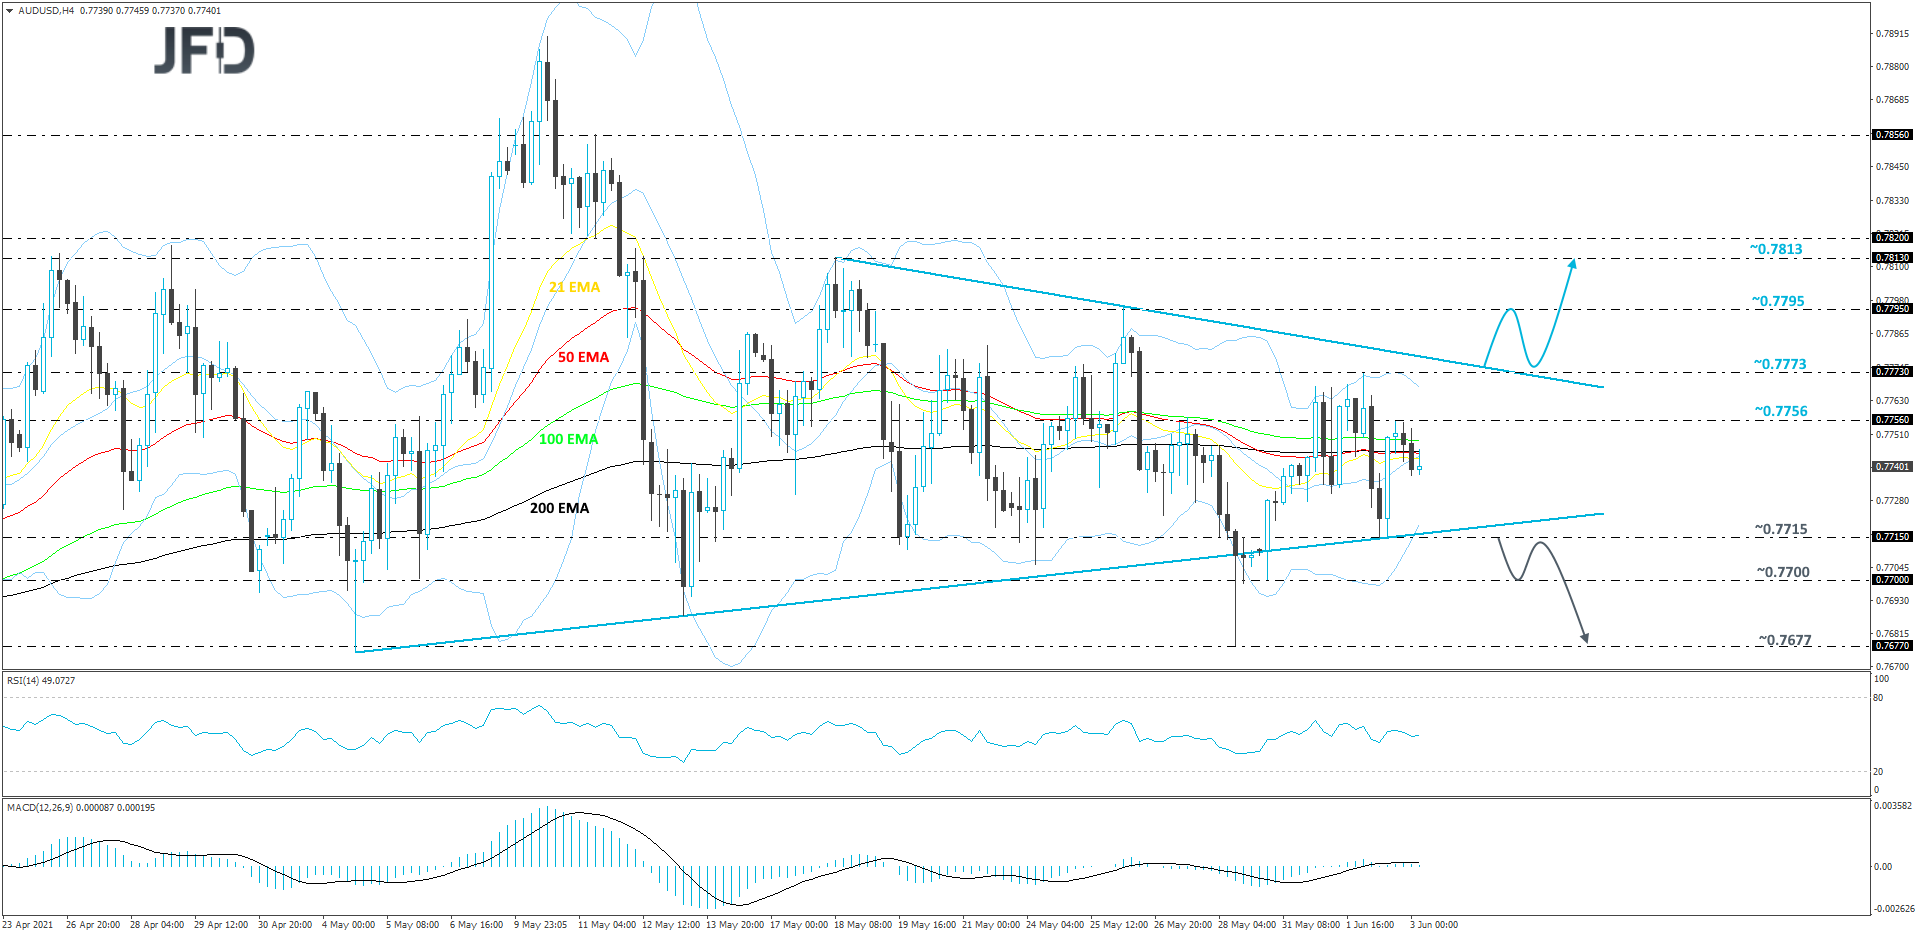
As For The Rest Of Today's Events
Apart from the initial jobless claims, the ISM non-manufacturing index, and the ADP employment report coming out from the US, we also have the final services and composite Markit PMIs for May from the Eurozone, the UK and the US. However, as it is the case most of the times, they are expected to confirm their preliminary estimates.
As for the speakers, we will get to hear from Atlanta Fed President Raphael Bostic and Fed Governor Randal Quarles. Bostic sat on the dovish spectrum of the Fed, saying that there is no reason to change policy despite inflation fears, while Quarles signaled that he is open to discuss adjustments to the Committee’s bond purchase program. With that in mind, it would be very interesting to see what they have to say today.