Get 40% Off
🔥 This hedge fund gained 26.16% in the last month. Get their top stocks with our free stock ideas tool.See stock ideas

Are U.S. Major Indices About To Go Parabolic?

Published 02/16/2017, 12:07 AM
Updated 07/09/2023, 06:31 AM
NDX
-
US500
-
DJI
-
US2000
-
IXTR
-
DJT
-
DJU
-
OEX
-
VIX
-

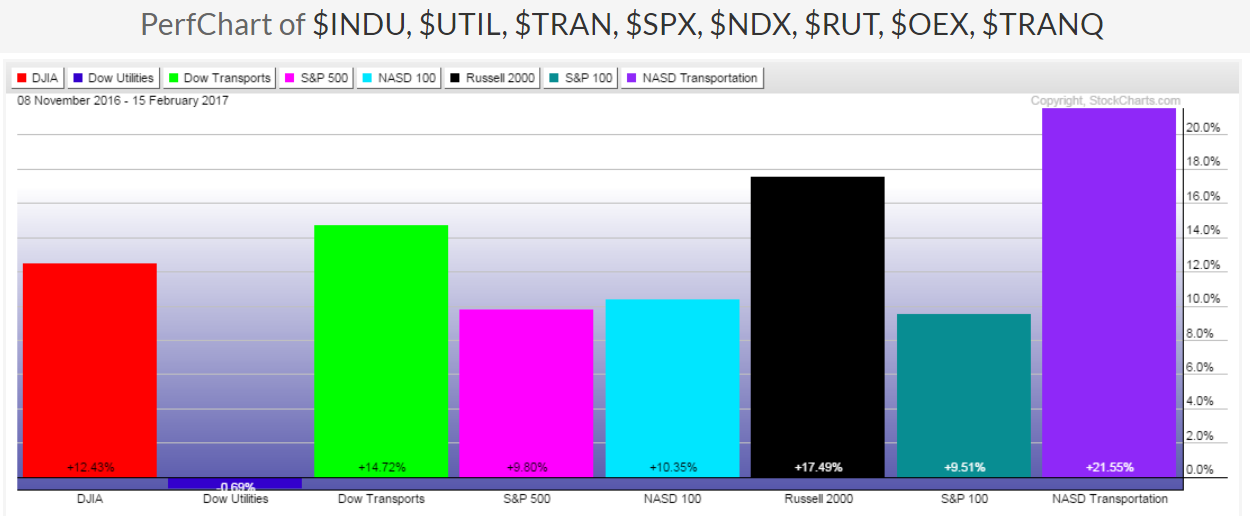
From the following 1-Year Daily chart of the U.S. Major Indices—the Dow Jones Industrial Average, Dow Jones Utility, Dow Jones Transportation, S&P 500, Nasdaq 100, Russell 2000, S&P 100 and NASDAQ Transportation—and the graph depicting percentages gained/lost since November 8, 2016 (election day), you can see the huge gains that they've made since the election, except the Utilities Index. In spite of the relative flatness of Utilities since then, all of them remain above their 50-day moving average.

US Major Indices 1-Year Daily US Major Indices, Percentages Gained/Lost Nov. 2016-Present

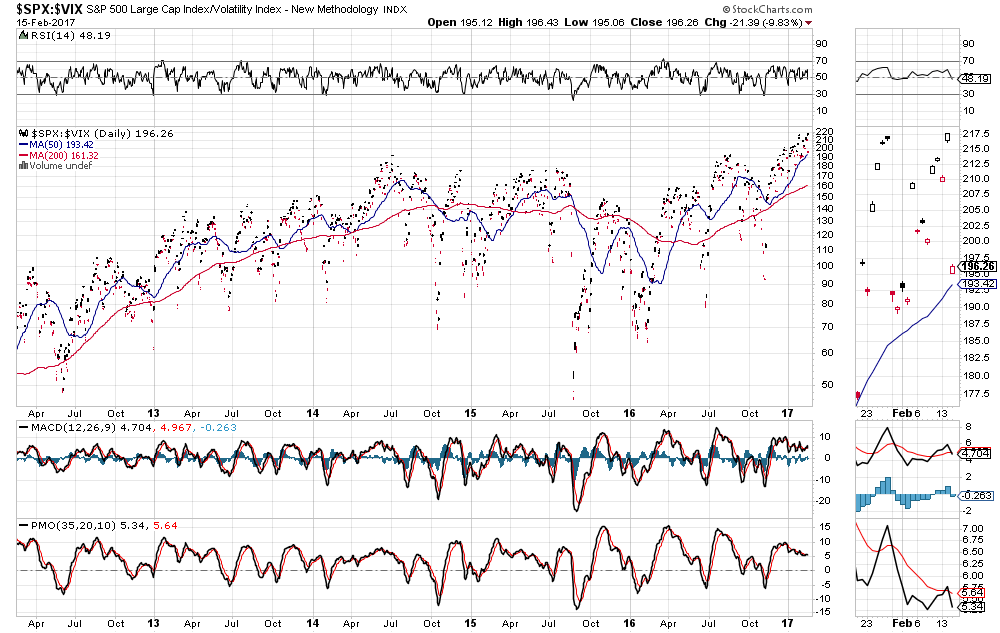
The following 5-Year Daily chart of the SPX:VIX ratio shows that, while the SPX made an all-time new high yesterday (February 15th), this chart failed to confirm the latest price spike. The RSI has fallen below the 50 level, and the MACD and PMO indicators have formed bearish crossovers...potentially signalling, either an imminent pause in equity buying, or some profit-taking in the near term.

SPX:VIX Daily 2012-2017

Bottom line: The above-mentioned indices look like they're about to go parabolic in a continued price spike. If they do, I'd keep an eye on the SPX:VIX ratio to see whether we get a higher price confirmation, together with a new "BUY" signal on the technical indicators (e.g., a higher RSI swing high, and bullish crossovers on the MACD and PMO). If we do, it's important that these three indicators remain in such a "BUY" mode on any near-term pause or pullback on the SPX as a gauge of subsequent market strength. Otherwise, we may see some larger profit-taking occur over the medium term.

3rd party Ad. Not an offer or recommendation by Investing.com. See disclosure here or remove ads .

Latest comments

Good
this was the irrational exuberance that occurred in late 1999 leading to the devastation in January of 2000. anytime index graph approaches the vertical it's time to get out
In order to strengthen the above conclusion: Since this week we have seen markets globally , cooling off . Gold is rallying and yields are on a decline even bonds are on for sell off . We will be experiencing a ply of capital from riskier to safer havens; the yen is on a stronger position against dollar. Hedge fund managers have been reducing their long calls on dollars since last week . Because, now equities are tumbling and is failing to find immediate support levels .
Equities are tumbling..? What index are you looking at. Or are you looking at your computer screen upside down?
Risk Disclosure: Trading in financial instruments and/or cryptocurrencies involves high risks including the risk of losing some, or all, of your investment amount, and may not be suitable for all investors. Prices of cryptocurrencies are extremely volatile and may be affected by external factors such as financial, regulatory or political events. Trading on margin increases the financial risks.
Before deciding to trade in financial instrument or cryptocurrencies you should be fully informed of the risks and costs associated with trading the financial markets, carefully consider your investment objectives, level of experience, and risk appetite, and seek professional advice where needed.
Fusion Media would like to remind you that the data contained in this website is not necessarily real-time nor accurate. The data and prices on the website are not necessarily provided by any market or exchange, but may be provided by market makers, and so prices may not be accurate and may differ from the actual price at any given market, meaning prices are indicative and not appropriate for trading purposes. Fusion Media and any provider of the data contained in this website will not accept liability for any loss or damage as a result of your trading, or your reliance on the information contained within this website.
It is prohibited to use, store, reproduce, display, modify, transmit or distribute the data contained in this website without the explicit prior written permission of Fusion Media and/or the data provider. All intellectual property rights are reserved by the providers and/or the exchange providing the data contained in this website.
Fusion Media may be compensated by the advertisers that appear on the website, based on your interaction with the advertisements or advertisers.
© 2007-2024 - Fusion Media Limited. All Rights Reserved.