EUROPE, JAPAN and USA:
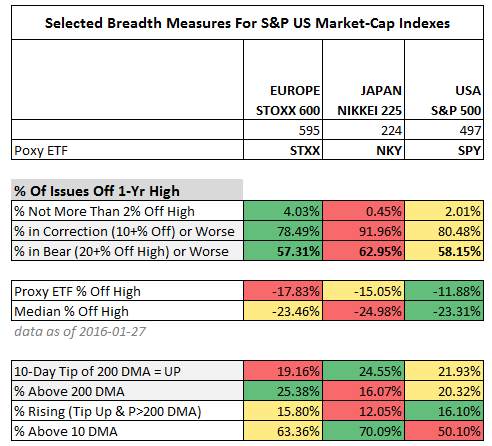
Back in December, many institutions recommended over-weighting Europe, and some preferred Japan. They may still feel so, but at this time the internals for the key European and Japanese stock indexes are just a lousy as for the S&P 500.
Europe’s STOXX 600 has the highest portion of stocks within 2% of their trailing 1-year high at 4.03%, but that is not good. Japan’s Nikkei 225 is near zero at 0.45%. The S&P 500 is between Europe and Japan at 2.01%
- The percentage of constituents of the STOXX in a 10% Correction or worse is 78.49%; Japan 91.96% and the USA 80.48%. Those are very bad numbers
- The percentage of constituents of the STOXX in a 20% Bear or worse is 57.31%; Japan 62.95%; and the USA 58.15%. Those are very, very bad numbers.
You can see from the table image, above, that the depth of the problem is not evident in the price performance of the indexes themselves, which are market-cap weighted and dominated by a small number of mega-cap members.
The median STOXX member is 23.46% off its high, while the index is only off 17.83%. Both are bad numbers, but the median stock is about 6% farther from its high than the index is from its high.
Japan and the US show even greater divergences. While all three indexes have similar median stock positions relative to their trailing highs, Japan’s median stock is about 10% off its high more than the NIKKEI; and the S&P 500 median stock is about 11.5% farther off than the index.
Only about 20% to 25% of the constituents of those three indexes have 200-day indexes with the tip pointing up (75% to 80% have tips pointing down). The direction of the tip of the trend line is an important thing, as it takes a lot of force to make it change direction from positive to negative, or from negative to positive.
The percentage of members of those indexes that have prices above their 200-day averages is similar to the percentages with trend line tips pointing up.
We defined “rising” as a condition where both the tip of the trend line is pointing up AND the price is above the trend line. Based on that arbitrary definition only 12% to 16% of members of the three indexes are “rising”.
Looking at the very short-term (the percentage of constituent stocks with prices above their 10-day moving average), the data are bit more encouraging (STOXX 63%, NIKKEI 70%, S&P500 50%).E
CHINA and INDIA:
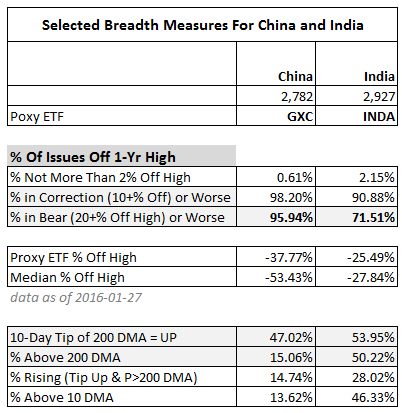
India is favored over China by many analysts, and this internal breadth data agrees with the point of view, at least in terms of the current condition of their respective markets.

This chart looks at the combined Shanghai and Shenzhen for China; and at the SENSEX for India.
While they both have over 90% of their constituents in Correction territory or worse condition (China worse at 98% and India better at 91%); India is much better off than China when it comes to the percentage of constituents in a 20% or worse Bear market (76% for India versus 96% for China).
- Only 15% of Chinese stocks are above their 200-day average, while 50% of Indian stocks are above.
- Using our definition of “rising”, only 15% of Chinese stocks are rising (similar to Europe, Japan and the USA), but 46% of Indian stocks are rising.
This is not a recommendation to invest in India, but it does appear that India is mending faster than China.
RELATED ETFs:

