The precious metal sector is under-performing this week amid demand pressures and a rising U.S.dollar. Agricultural commodities are staging a comeback on the back of supply issues and speculative short covering.
Precious metals
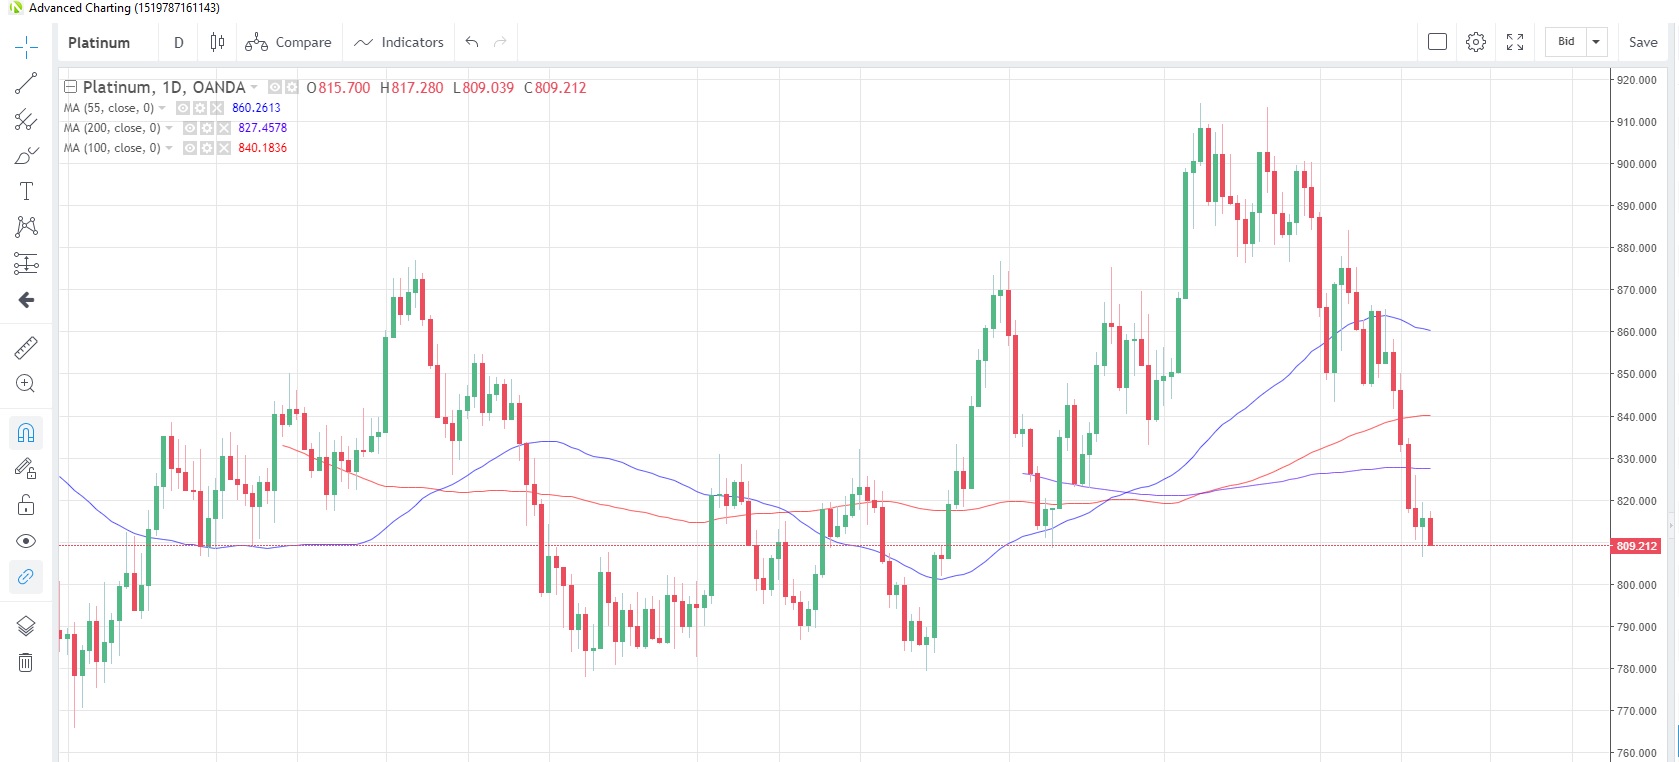
Speculative investors scaled back their bullish platinum bets to the lowest since the beginning of April in the week to May 14, according to the latest data snapshot from CFTC. Since then, platinum had its worst week last week since November, tumbling 5.4%, and continued the losses into this week, hitting the lowest level since February 19 yesterday.
One of the factors behind platinum’s fall from grace has been a weakening in car sales from the U.S., to Europe and China. Given the use of platinum in a car’s catalytic converter exhaust system, lower car demand would lead to slackened demand for the precious metal.
Platinum Daily Chart
Source: OANDA fxTrade
Palladium had its fall from lofty heights above 1,600 back in March, and since then has traded in a consolidative 1450-1300 range. The darling of the markets last year saw bullish bets increase steadily from August through to December while the price rally lasted all the way through until March. Net long positions held by speculative accounts are now at their lowest since the week of September 18 with palladium trading at 1,322.
Gold has succumbed to the U.S. dollar’s strength since last week and slid the most in four weeks last week. Despite the uncertainty surrounding the escalation in the U.S.-China trade war, gold has been unable to secure a safe haven foothold and has failed to register a close above the key 1,300 level so far this month. It is even facing the fourth monthly decline in a row after peaking at 1,347 in February.
That said, speculative investors still remain bullish on the yellow metal, adding to net long positions for a third straight week to May 14, while boosting net longs to the highest since February 26.
In contrast, speculative investors increased their bearish bets against silver for a second straight week, the latest data from CFTC to May 14 shows, with net short positioning is at its highest since November. Exchange-traded funds sold 3.3 million ounces of silver from their holdings in the latest trading session, according to a Bloomberg report yesterday. That was the biggest one-day cut since January 18.
Base metals
Copper prices attempted a rebound last week amid supply concerns, with China mines facing shutdowns for routine maintenance and those in Chile facing possible disruption as labour negotiations commence. The rebound proved to be short-lived however, with those gains having been wiped out already this week.
The ongoing U.S.-China trade war continues to be a burden for copper as stocks at warehouses monitored by the London Metal Exchange have remained steady since May 8.
Energy
Crude oil has tight-ranged for the past week, taking the weekend OPEC+ meeting in Jeddah in its stride. The cartel and its allies agreed to keep the current production cuts in place past the June deadline, though there was an element of dissent from Russia. The continuing spat between the U.S. and China is causing a rethink of future oil demand, and the weekly oil stockpile data from both the EIA and API have both showing increases in inventories recently.
Tonight’s data release from the American Petroleum Institute is expected to show a further increase of 2.4 million barrels in the week to May 17, after an addition of 8.6 million barrels the previous week.
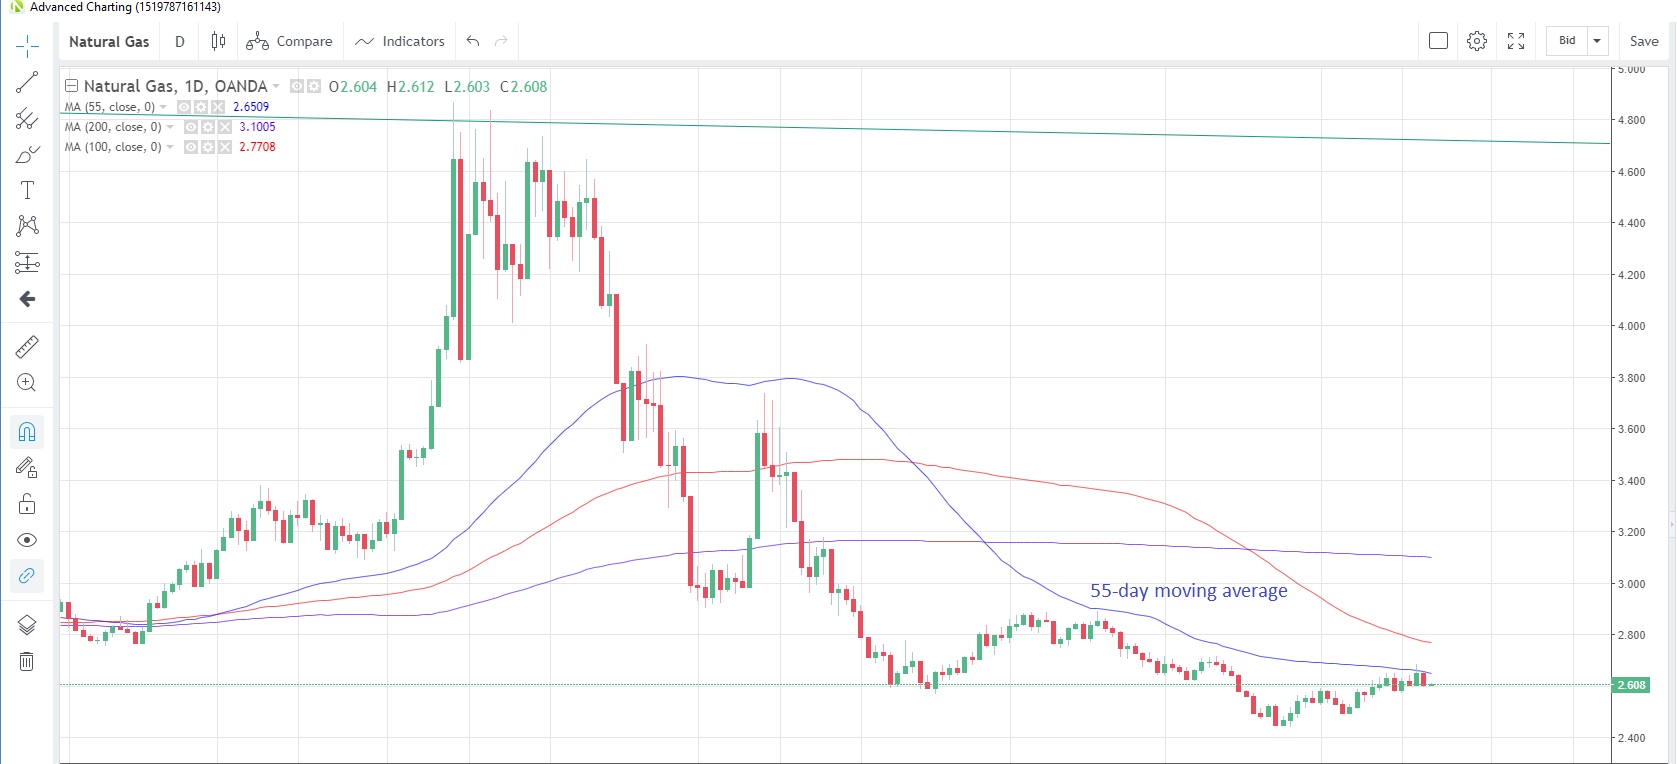
Natural gas could be facing a fourth weekly advance in five weeks this week, but the gains so far have been slow and gradual and total a 10% increase from the 2-1/2 year lows struck in late April. Forecasts of cooler weather across Scandinavia next week may help to support prices with an increase in demand seen for heating purposes, but this is countered somewhat by forecasts of normal temperatures across the rest of Europe for the same period.
Natural gas needs to break above the 55-day moving average at 2.6509 to stand a chance of a more constructive rebound. This moving average has capped prices on a closing basis since December 18 last year. Gas is currently trading at 2.611.
Natural Gas Daily Chart
Source: OANDA fxTrade
Agriculturals
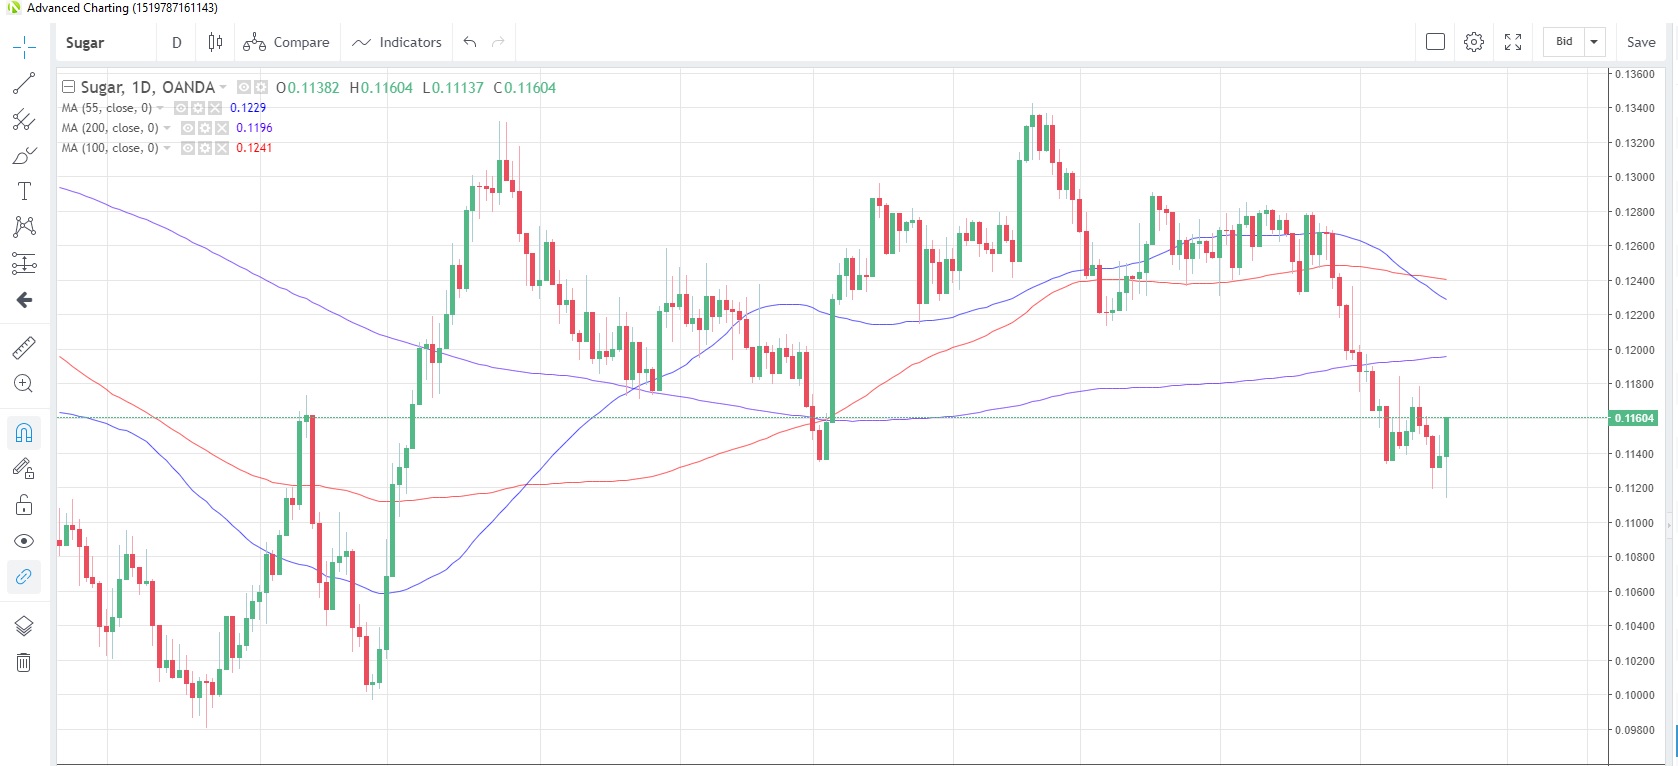
Sugar touched a 5-1/2 month low yesterday but staged a recovery in the latter part of the day to close higher. This could form a potential outside-range day for the commodity, a bullish technical signal which would be confirmed with another higher close today.
The rebound could have been caused by supply concerns coupled with an uptick in demand for ethanol production. Heavy rains are reportedly slowing the harvest in Brazil, while higher oil prices are expected to trigger a spike in ethanol demand, particularly in Brazil.
The latest data shows that speculative investors are not so enthusiastic about a prolonged rally. They increased their net short positions for a second week, bringing net short positions to the highest since the week of October 2.
Sugar Daily Chart
Source” OANDA fxTrade
Corn prices have been on a tear for the past two weeks, soaring a hefty 16.7% from the eight-month low of 3.333 seen on May 13. The rally comes amid a perceived shortage of supply, with reports suggesting that US corn planting for this time of year has been reduced to the slowest pace on record amid storms, flooding and tornadoes.
Couple that with a market that was perhaps overly short of the commodity and the rebound took flight. Latest data from CFTC showed that net short positions were already being scaled back for a second straight week as at May 14, but were still aggressively net short.
Bearish bets on soybeans are at the highest in more than 20 years, according to data outlining speculative positioning as at May 14 from CFTC. Prices rose for the first time in six weeks last week and look set to extend those gains in to this week, which could force more exits from short positions.
Wheat also rebounded last week, posting the biggest weekly gain since June 2017, amid speculative short-covering and concerns about falling supply. Speculative accounts reduced their net short positions for a second straight week in the week to May 14, according to CFTC data, and they are now at the lowest in four weeks. Reports are also suggesting the EU exports are down 1% in the 2019 season which started last July.


