Get 40% Off
💰 Buffett reveals a $6.7B stake in Chubb. Copy the full portfolio for FREE with InvestingPro’s Stock Ideas toolCopy Portfolio

Charts To Ponder

Published 02/28/2016, 01:39 AM
Updated 07/09/2023, 06:31 AM
US500
-
US2000
-
DJT
-
DJUSIN
-
HUI
-

Instead of doing videos this weekend, I’m just going to do an overview of some general, but I think important, charts. I don’t have these in any particular order, but I’ll make a few remarks about each of them. So here we go……..

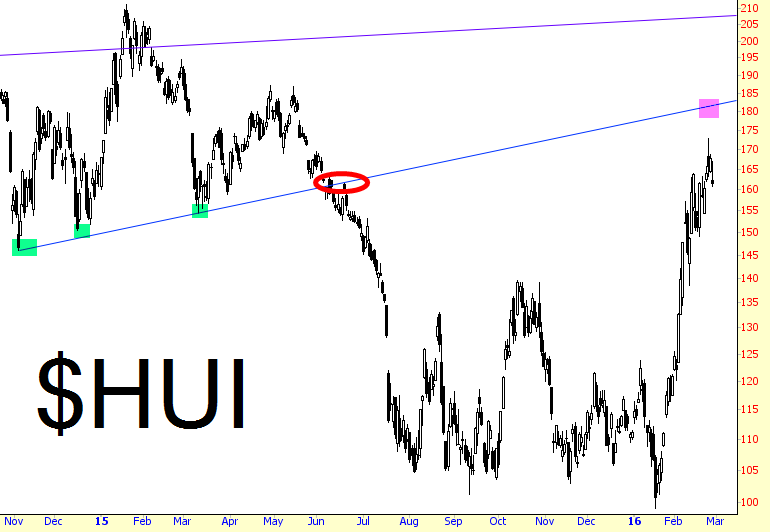
First up is the gold bugs index. This roared about 75% higher from its low just last month, and I definitely think it’s due for a breather. You can see how the trendline I’ve drawn represented supported (with green tints showing support in action), then it broke (red circle), and then the line changed its role to resistance (magenta tint).
HUI Chart

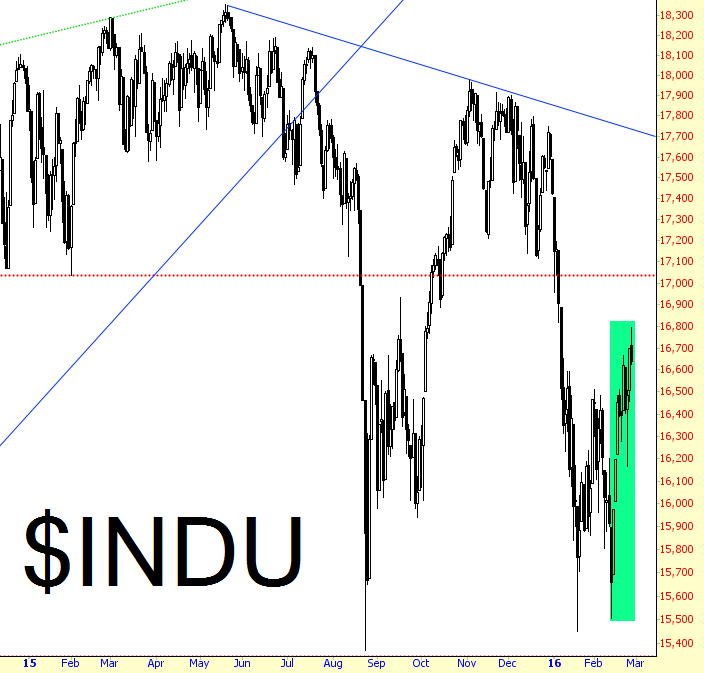
The Dow Industrials had its own ascent, and although the percentage move wasn’t as big, the point move was gigantic: nearly 1300 points in just a couple of weeks (this was no fun, let me assure you). It’s hard to pinpoint where all the overhead supply reaches critical mass, but I’ve drawn a horizontal just above 17,000 as a fairly decent guide for resistance.
INDU Chart

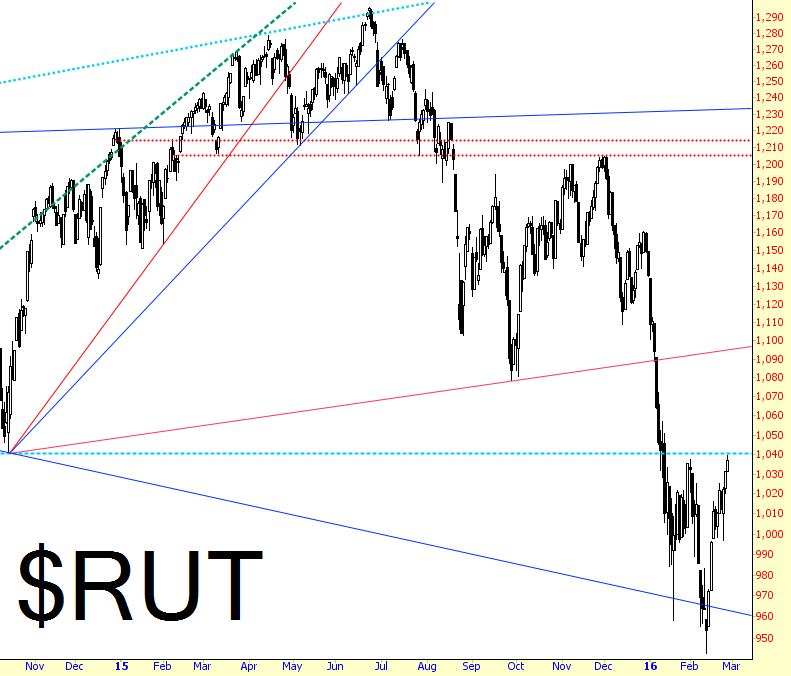
The Russell 2000 (small caps) obviously moved the same as any other big index, but its shape is somewhat different than most. The February 11 low was a meaningful amount lower than the one from January 20, and we’ve got a decent horizontal at 1040 which, for the moment, represents resistance. Crossing above this level would assign the new role of “resistance” to the tilted red trendline above it, which is at about 1100.
RUT Chart

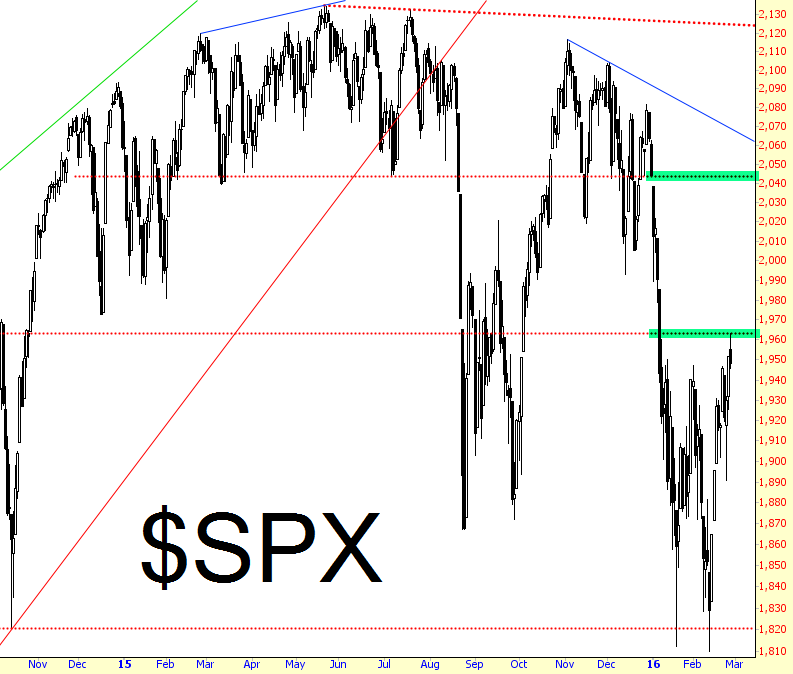
The S&P 500 harkens back to my Thing One and Thing Two post, which you can see with the green tints below. Of course, now that Gartman has abandoned his bearish stance and is once again bullish, we might have a real chance at avoiding a trek to the higher level.
3rd party Ad. Not an offer or recommendation by Investing.com. See disclosure here or remove ads .

SPX Chart

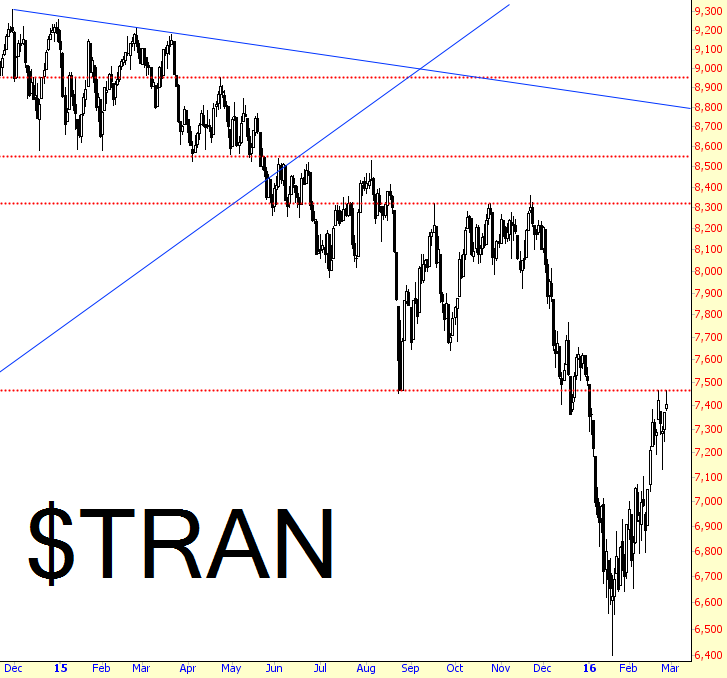
The Transports are a particularly fascinating chart. The graph below doesn’t show it from the long-term perspective, but from a greater distance, transportation stocks look exceptionally toppy.
TRAN Chart

I’ll publish more of these Sunday morning.

Latest comments

Risk Disclosure: Trading in financial instruments and/or cryptocurrencies involves high risks including the risk of losing some, or all, of your investment amount, and may not be suitable for all investors. Prices of cryptocurrencies are extremely volatile and may be affected by external factors such as financial, regulatory or political events. Trading on margin increases the financial risks.
Before deciding to trade in financial instrument or cryptocurrencies you should be fully informed of the risks and costs associated with trading the financial markets, carefully consider your investment objectives, level of experience, and risk appetite, and seek professional advice where needed.
Fusion Media would like to remind you that the data contained in this website is not necessarily real-time nor accurate. The data and prices on the website are not necessarily provided by any market or exchange, but may be provided by market makers, and so prices may not be accurate and may differ from the actual price at any given market, meaning prices are indicative and not appropriate for trading purposes. Fusion Media and any provider of the data contained in this website will not accept liability for any loss or damage as a result of your trading, or your reliance on the information contained within this website.
It is prohibited to use, store, reproduce, display, modify, transmit or distribute the data contained in this website without the explicit prior written permission of Fusion Media and/or the data provider. All intellectual property rights are reserved by the providers and/or the exchange providing the data contained in this website.
Fusion Media may be compensated by the advertisers that appear on the website, based on your interaction with the advertisements or advertisers.
© 2007-2024 - Fusion Media Limited. All Rights Reserved.