US banks warn trading down in second quarter
US markets extended losses on Wednesday on mixed data. The dollar declined further: the live dollar index data show the ICE US Dollar index, a measure of the dollar’s strength against a basket of six rival currencies, closed down 0.42% at 96.978. The S&P 500 lost less than 0.1% settling at 2411.80 paring earlier losses, led by financial stocks down 0.8%. Four out of 11 main sectors ended in negative territory. The Dow Jones industrial average slipped 0.1% to 21008.65, weighed by losses in Goldman Sachs (NYSE:GS) and JPMorgan Chase & Co (NYSE:JPM) shares, both down more than 2% . NASDAQ retreated less than 0.1% to 6198.52. All three indexes ended May in positive territory.
Uncertainty about UK general election in June persists
European stock indices ended mostly lower on Wednesday as political uncertainty in UK and mixed data failed to bolster market sentiment. Both the euro and British Pound gained against the dollar. The Stoxx Europe 600 index slid 0.1%. Germany’s DAX 30 outperformed rising 0.1% to 12615.06. France’s CAC 40 fell 0.4% but UK’s FTSE 100 index fell 0.1% to 7519.95.
China factory activity contracts for first time in nearly a year
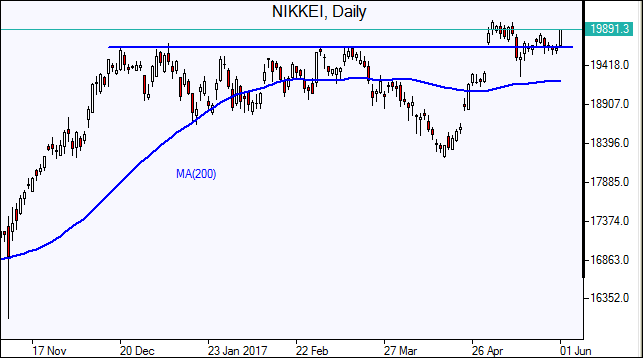
Asian stock indices are mixed today after Caixin private survey data showed China's manufacturing activity contracted in May for the first time in 11 months. Nikkei ended 1.1% higher at 19860.03 as the dollar resumed the growth against the yen and reports indicated Japanese capital spending rose in the first quarter. Chinese stocks are down after the Caixin Manufacturing PMI fell to 49.6 in May from 50.3 in April. A reading below 50 indicates contraction. The official data on Wednesday showed steady growth with PMI at 51.2. Shanghai Composite Index is 0.5% lower while Hong Kong’s Hang Seng Index is up 0.5%. Australia’s ASX All Ordinaries is 0.2% higher as the Australian dollar continued the slide against the US dollar.

Oil slips on expected US Inventories drop
Oil futures prices are rising today on expected decline of US oil inventories. Data from the American Petroleum Institute industry group showed crude inventories were down by 8.7 million barrels at 513.2 million last week, a bigger draw than analysts’ expectation of a 2.5 million barrels decrease. Prospective gains may be limited however in light of recent data pointing to continued increase in global oil output. Output from OPEC rose in May, the first monthly increase this year, according to a Reuters survey. Prices ended lower yesterday: July Brent crude fell 3% to $50.31 a barrel on Wednesday on London’s ICE Futures exchange. The US Energy Information Administration will report US crude oil inventories at 17:00 CET today.
