
AT40 = 31.0% of stocks are trading above their respective 40-day moving averages (DMAs) (was as low 28.1%)
AT200 = 46.7% of stocks are trading above their respective 200DMAs
VIX = 14.0 (was as high as 15.8)
Short-term Trading Call: neutral
Commentary
So much for a small bounce before continuing a decline toward oversold conditions!
The jobs report for September seemed to be a non-event as the S&P 500 (via SPDR S&P 500 (NYSE:SPY)) opened slightly higher and drifted higher for the first 15 minutes of trading or so. By the second breakdown to an intraday low, it was clear that sellers were eager to hit the exits. For the S&P 500, the selling ended just below its 50-day moving average (DMA). Buyers took over from there and pulled the index back from an ominous 50DMA breakdown.

The S&P 500 (SPY) briefly broke down below its uptrending 50DMA support before buyers rallied the index back to its intraday low from the previous trading day.
Like the S&P 500, small caps gave some faint hope of a bottom as buyers picked the iShares Russell 2000 (NYSE:IWM) off the very critical support of an uptrending 200DMA.

The iShares Russell 2000 ETF (IWM) closed at a 4-month low after buyers picked the small cap index off 200DMA support.
The parallel selling in the NASDAQ confirmed a 50DMA breakdown. The selling in Invesco QQQ Trust (NASDAQ:QQQ) created the 50DMA breakdown that the tech-laden index barely avoided the previous trading day.

The NASDAQ closed near a 3-month low as sellers confirmed the previous day’s 50DMA breakdown.

The Invesco QQQ Trust (QQQ) reversed all its gains from late August with its 50DMA breakdown.
The selling even took down financials which had rallied going into Friday’s jobs report. The Financial Select Sector SPDR ETF (NYSE:XLF) lost 0.4% after 50DMA resistance rejected it and sent XLF to a fresh 200DMA breakdown.

The Financial Select Sector SPDR ETF (XLF) turned back neatly from 50DMA resistance and again broke down below its 200DMA.
At the height of the selling, the volatility index, the VIX, soared to a 22.1% gain. This move was below the previous day’s 36.4% intraday high. The VIX closed with an even smaller gain of 4.2% as the volatility faders went into hyperdrive after buyers started defending critical technical levels on the indices. The VIX even closed below the 15.35 pivot in a demonstration of the continued stubbornness of bullish sentiment that keeps tilting toward complacency.

Faders pushed so hard on the volatility index, the VIX, that it swung from a 22% intraday gain to a 4% close below the 15.35 pivot.

Finally, AT40 (T2108), the percentage of stocks trading above their respective 40DMAs, dropped into the 20s for the first time in 6 months. The buying off the lows only took AT40 back to 31.0%. AT200 (T2107), the percentage of stocks trading above their respective 200DMAs, dropped to a 5-month low by closing at 46.7%. So while the shorter-term indicator is at levels that have frequently marked bottoms in this bull market, the longer-term indicator is not yet creating the kind of breakdowns that overwhelm bulls with bargain signs.
This spot is particularly tough for making a short-term trading call. I left the short-term trading call at neutral only because the risk of new short positions is pretty high at this juncture. I closed out some shorts and put positions last week even and have nothing new on my list of shorts. This is a better time to prepare to buy. In other words, I am purposely avoiding getting bearish so that I can be ready to buy the market at lower prices. Recall that October is one of the riskiest months of the year in terms of potential drawdowns. Yet, with November and December offering two of the lowest risk months of the year, October can offer some timely buy-the-dip opportunities.
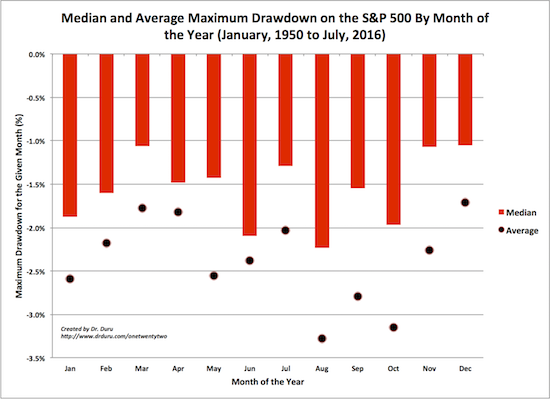
August, September, and October are the S&P 500’s most dangerous months on an average basis. On a median basis, maximum drawdowns do not have such a dramatic spread of performance.
Source for data: Yahoo (NASDAQ:AABA) (NASDAQ:Yhoo Finance
I am guessing that October is all the more dangerous this year given the exceptionally strong stock market performance in the third quarter (July to September). In other words, the market is “due” for more than a garden variety 1% or 2% drawdown on the S&P 500.
I think technician Carter Worth made a good case for a retest of the 2800 level on the S&P 500. See below.
https://twitter.com/twitter/statuses/1048321640411664386

The 2800 level was important as resistance in June and then important as support from July to August. By the time the S&P 500 gets back to 2800, uptrending 200DMA support should be there to meet the index with a kiss. More importantly, AT40 should also be at or near true oversold levels (20%).
Even with this mental model, I am preparing for the possibility that last week’s selling was about as good as it well get. After all, sellers dramatically failed twice to keep the VIX elevated. If I see enough sign of buying power, small caps, IWM specifically, would be the obvious place to start under the assumption that 200DMA support is holding. A complete reversal of Friday’s losses would be a good first sign.
CHART REVIEWS
Apple (NASDAQ:AAPL)
On Wednesday, AAPL broke out to a new all-time high and even closed well above its upper Bollinger Band (BB). At the time, I thought that move confirmed the market’s readiness to rip higher. The subsequent reversal could form the start of a kind of blow-off top. An AAPL at another all-time high would serve as an assurance that the sellers have once again been banished.

Apple (AAPL) printed an impressive breakout to another all-time high right before sellers drove the stock into its 20DMA. For many bulls, AAPL is likely already looking like a buy-the-dip opportunity.
Amazon.com (NASDAQ:AMZN)
AMZN is one of the usual suspects that looks dangerous to me. Its last rally stopped cold just under all-time highs. Unlike AAPL, AMZN has struggled to hold onto its $1 trillion market cap. Last week’s 50DMA breakdown seemed to confirm a double top. AMZN has not tested its 200DMA uptrend for an incredible 2 1/2 years. A “real” sell-off could and should force that issue.

Amazon.com (AMZN) return all its gains since late August. AMZN also broke 50DMA support for the first time since April. AMZN could be a special case as its 50DMA breakdown confirmed an ominous double-top.
Alibaba Group Holding (NYSE:BABA)
I made 2018 the year I would finally ride BABA higher into November’s Single’s Day. It looks like Chinese weakness in the face of a withering trade war with the U.S. will thwart my plans.

Alibaba Group Holding (BABA) is still showing no signs of interest in next month’s Single’s Day in China. BABA closed at a 14-month closing low with a downtrend neatly defined by its 20 and 50DMAs.
Caterpillar (NYSE:CAT)
CAT is the perfect hedge on bullishness because it rallied right into resistance that has held for most of 2018. Critical 200DMA support awaits below.
 Chart")
Caterpillar (CAT) broke out on Wednesday only to find resistance at levels that have dogged the stock most of the year. A new 200DMA breakdown should ignite a fresh rush of selling.
Equifax (NYSE:EFX)
I just happened to check in on EFX and was blown away that the stock almost closed its gap from last year’s data breach related gap down. I do not think there was much fanfare about the milestone. I assume last week’s 50DMA breakdown ended the upward momentum to a complete gap fill for now.

In mid-September, Equifax (EFX) quietly approached the top of its massive gap down from September, 2017. Sellers have regained control with a new 50DMA breakdown.
Facebook (NASDAQ:FB)
FB’s struggles are very telling. Its under-performance among the “usual suspects” may at some point force it right out of the club.

Facebook (FB) is closing in on its post Cambridge Analytica lows. A spirited rebound in late September just provided a fresh opportunity for shorts.
General Electric (NYSE:GE)
Ironies run deep with GE. Buyers are celebrating a convincing bottoming process just at the point the general market is facing its most oversold levels in 5 to 6 months. The stock has cleared all hurdles that defined for me a confirmed bottom. From here a clear stop is a new low (below $11).

General Electric (GE) is having a rare bout of out-performance as a bottoming pattern continues to unfold even amid general market weakness.