The stabilisation seen in markets yesterday has aggressively dissipated after US markets failed to hold early gains overnight. A lot of recent data has emphasised that the bottom has not quite fallen out of the global economy, but a negative feedback loop of self-perpetuating fear seems to have gripped global markets. China’s poor communication of FX policy and concomitant selloff in its equities appear to have lit a fire of negativity beneath global market sentiment. The threat of a dramatic devaluation by the Chinese government to ease its deflationary and debt-related pressures hangs heavy on markets like a Sword of Damocles. Despite China’s successful efforts this week to regain control over the offshore renminbi, the possibility of a major one-off devaluation in the currency is probably far higher than a black swan tail risk event. The fact that it is reportedly even being discussed by People’s Bank of China (PBoC) advisors likely assigns it a probability as high as 20%.
In such a situation, it is relatively futile to push back against markets and point to the fact that fundamentals are doing OK. Markets are not rational, and when they are in the throes of the powerful forces of greed and fear, seemingly sensible arguments are redundant.
That’s not to say that those calling for a 75% correction in the S&P 500 should be taken as a base case. Nonetheless, we are seeing a wide range of asset classes (the ASX and the AUD/USD for example) sitting on the edge of a precipice for a major break downward. But exhortations to “sell everything” are not necessarily wise investment decisions. Although caution does seem a prudent course of action. Trimming back position size, increasing cash holdings, tightening stop losses, putting some money into gold, hedging portfolio positions through put options or index shorts are all valid actions in the event that markets continue this slide.
China
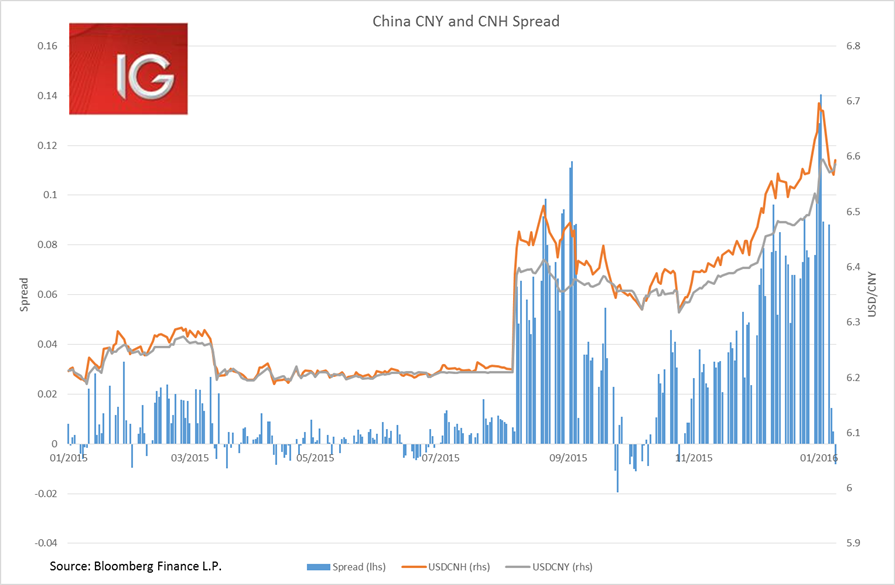
China has aggressively reined in the offshore CNH with the spread in the onshore offshore CNY moving from 1405 pips to below 100 pips. Of course, this has likely taken a further heavy toll on China’s FX reserves in January. PBoC advisor Li Daokui had intimated that there may be a red line in China’s FX reserves at US$3 trillion. Given FX reserves are only sitting at just over US$3.3 trillion and China’s interventions have been costing roughly US$100 billion a month, this red line is likely to be hit in March or April. The question then remains, does China then greatly minimise its interventions in the currency markets? The other pressing aspect is that as China depletes its FX reserves, it is reducing liquidity within its own banking system, necessitating further monetary easing through interest rate or reserve requirement ratio cuts. The dilemma is that this then only puts further pressure on the CNY to depreciate. So you see why the PBoC may conclude that a one-off 10-15% devaluation may in fact be the most prudent course if they desire to hold this US$3 trillion red line in the sand.
The bounce in risk on mentality with regards to China’s better-than-expected trade data yesterday also bears some re-evaluation. One can clearly discern the effects of China’s stepped up fiscal stimulus in a range of economic data, ie. the pickup in IP, FAI, NBS PMIs, imports data. But this stimulus does look to be failing to reach China’s small and medium enterprises (SMEs). The performance in the SME sub-components in the NBS PMIs were dismal and the Caixin PMIs, which are more associated with the SMEs, were also worrying.
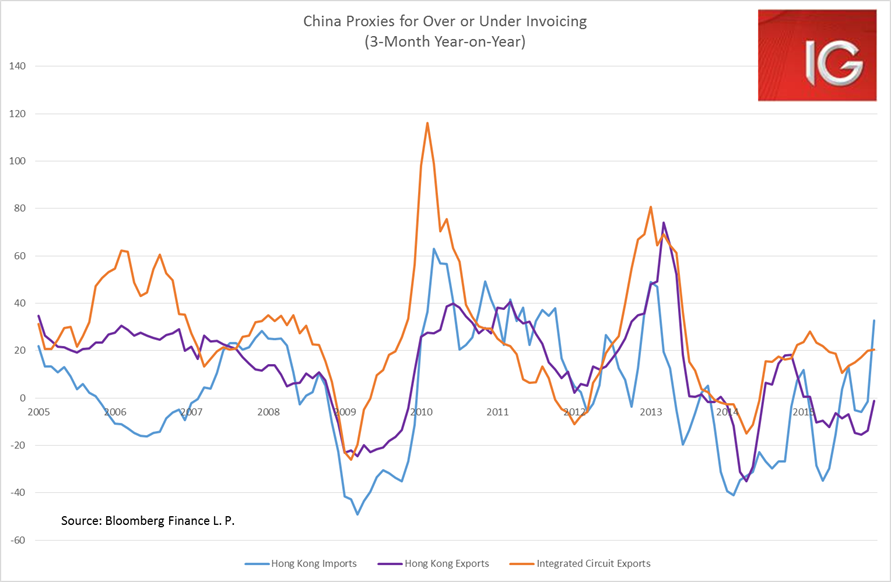
Elements of the trade data yesterday are consistent with this improvement in large mostly state-owned enterprise (SOE) corporates, and deterioration in the SME complex. China’s record import volume of iron ore in December at 96.3 million tonnes, a 17.2% month-on-month increase, does tally with these developments. The other important question related to the spike in China’s trade in December is how much the figures were boosted by capital flows related to under or over invoicing. Spikes in trade with Hong Kong are often a good indication of increased capital flows through the external account. China’s imports from Hong Kong jumped 64.5% year-on-year and exports to Hong Kong increased 10.8%. Another good proxy is integrated circuits trade, as they are very difficult to value objectively and relatively easy to transport in bulk. Integrated circuits exports were elevated, increasing 21.7% year-on-year (YoY) in December and 30.9% in November. Hence, yesterday’s trade numbers should not be totally comforting given a lot of imports went to loss making SOEs and total numbers were also inflated through capital flows.
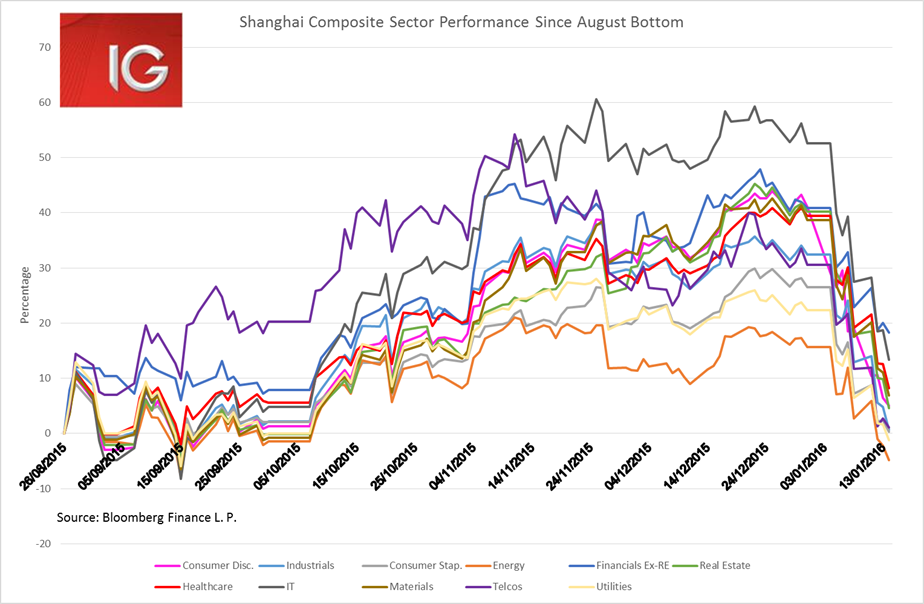
These concerns are clearly filtering into the ever-volatile Chinese equity markets. A glance at the sectoral performance of the Shanghai Composite tells one that this is a broad-based risk off movement in the Chinese capital markets. The selloff in the index has been extremely correlated across sectors. But the selloff in the better performing parts of the market has been most severe over the past week and a half, with the IT sector alone losing 45.8% from where it traded on 22 December.
ASX
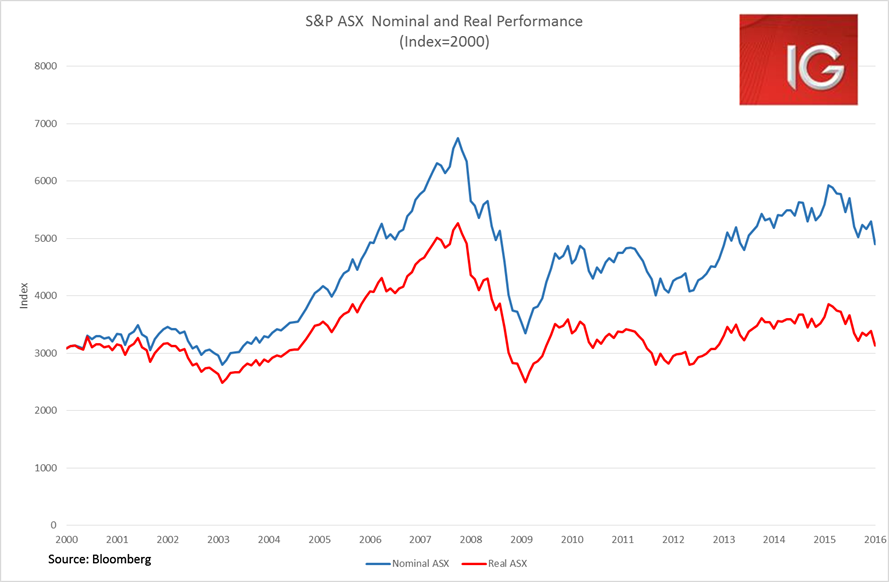
The ASX has been devastated today with global market risk dominating local trade. The AX looks set to close below some significant support levels. A close below 4923 would see it close below the 2011 uptrend and a close below 4910 would see it close below its August and September lows at levels not seen since July 2013. Of course, this is in nominal terms, in real terms the ASX is now trading back roughly where it was in November 2012 – cancelling out three years of gains. The concern is here in a technical sense there is not much of a support level to be seen for the ASX until 4800 or 4750.
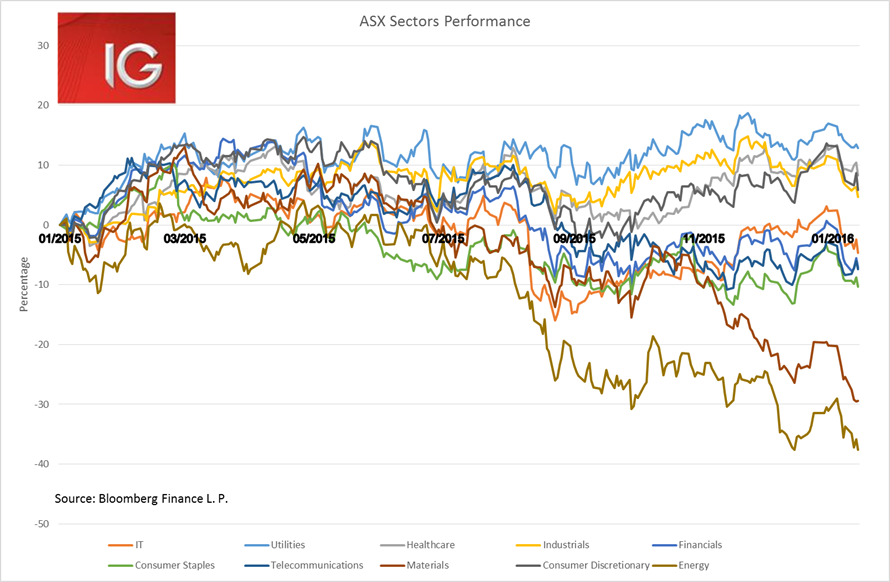
The decent Australia jobs data today has not really helped sentiment on the domestic economy, at least not in the S&P/ASX 200. Financials sold off more than 2% alongside consumer discretionary stocks, which lost 2.5%. But energy and IT sectors joined them in an over 2% sell off.
Fear is clearly in the market, with only the utilities sector managing to avoid the worst of the selloff over the past week and a half.
