By Abhiram Nandakumar
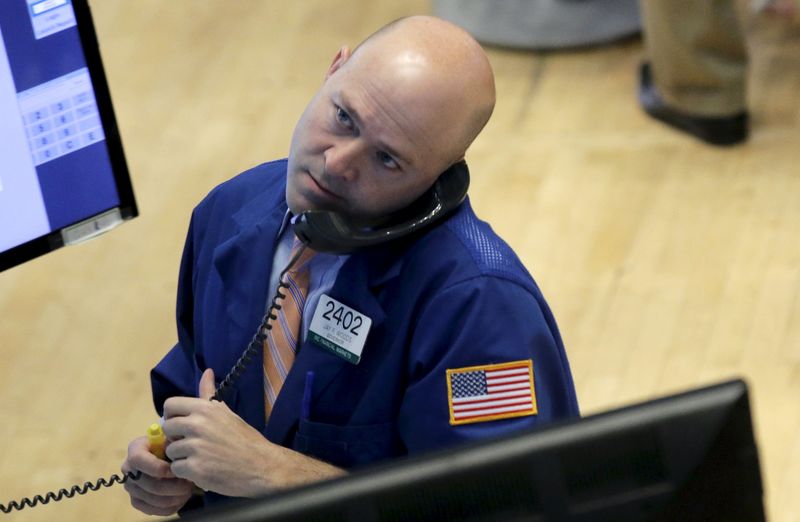
(Reuters) - U.S. stock indexes notched deep losses in volatile trading on Friday, with the S&P 500 hitting its lowest since October 2014 and the Dow losing more than 500 points, as oil prices dived below $30 per barrel.
All 10 major S&P sectors were in the red and all 30 Dow components lower. The Russell 2000 small-cap index fell as much as 3.5 percent to its lowest since July 2013.
The beaten-down energy sector's 4.43 percent slide led the declines, as oil prices fell 6.5 percent. The technology sector was down 4.31 percent, as Intel's weak report weighed heavily on chip stocks.
"Investors are scared to death, and the fact that it's happening at the beginning of year has some historical significance," said Phil Orlando, chief equity market strategist at Federated Investors in New York.
At 13:01 p.m. ET (1801 GMT), the Dow Jones industrial average was down 448.5 points, or 2.74 percent, at 15,930.55.
The S&P 500 was down 52.35 points, or 2.72 percent, at 1,869.49.
The Nasdaq Composite index was down 159.40 points, or 3.45 percent, at 4,455.60.
The three main indexes were set to test their percentage declines on Aug. 24 when the market plunged after China devalued the yuan.
The S&P 500 has fallen 13 percent and the Dow 13.7 percent from their highs in May, pushing them into what is generally considered as 'correction territory'.
The CBOE volatility index jumped as much as 29.2 percent to 30.95, it's highest since September.
"When we started off the year, we were at the crossroads of concern and optimism and clearly, we've gone down the road of concern pretty quickly," said Dan Farley, regional investment strategist at U.S. Bank Wealth Management in Minneapolis.
Dow components Exxon (N:XOM) and Chevron (N:CVX) were down 2.5-4 percent, while Caterpillar (N:CAT) dropped 4.4 percent.
Intel (O:INTC) tumbled 10 percent to $29.48, its steepest drop in seven years, after the chipmaker's results and forecast raised concerns about its growth.
That weighed on the chip index, which fell 5.8 percent, its steepest drop since March.
Citigroup (N:C) was down 7.5 percent at $41.99, while Wells Fargo (N:WFC) fell 4.6 percent to $48.29, after reporting largely in-line quarterly earnings.
Wynn Resorts was the among the very few bright spots, rising 7.4 percent to $55.29 after reporting in-line of quarterly revenue.
U.S. economic data on Friday was also not very encouraging, with an unexpected drop in retail sales and industrial output declining again in December, underscoring a worsening outlook for fourth-quarter economic growth.
"It depends on where we close today, but things could get worse before it gets better," said Art Hogan, chief market strategist at Wunderlich Securities in New York.
Declining issues outnumbered advancing ones on the NYSE by 2,850 to 240. On the Nasdaq, 2,527 issues fell and 289 rose.
The S&P 500 index showed no new 52-week highs and 135 new lows, while the Nasdaq recorded four new highs and 477 lows.