EUR/USD
Market was data driven this Wednesday, starting early Europe with German inflation readings, in line with expectations, a mild weak US ADP employment survey, and a strong US GDP reading, probably the most relevant event of the day. US economy shown an impressive 4.0% growth in the second quarter, compared to first one finally revised up to -2.1%. The EUR/USD sunk to a fresh year low of 1.3367 on the news, where it held until FOMC: the US Central Bank surprised no one with a $10B taper and a tiny changed to the wording in its statement over employment situation concerns that resulted in a downward correction for the greenback across the board. As for the EUR/USD, latest rally was contained by sellers in the 1.3400 area with the hourly chart showing price unable to open a candle above a still bearish 20 SMA and indicators just correcting extreme oversold readings accomplished earlier on the day. In the 4 hours chart momentum maintains a strong bearish tone, while RSI stands around 30 still trying to correct higher. Overall, the downside remains favored, with a break below the daily low exposing 1.3295, November 2013 monthly low.
Support: 1.3370 1.3335 1.3295
Resistance: 1.3405 1.3440 1.3475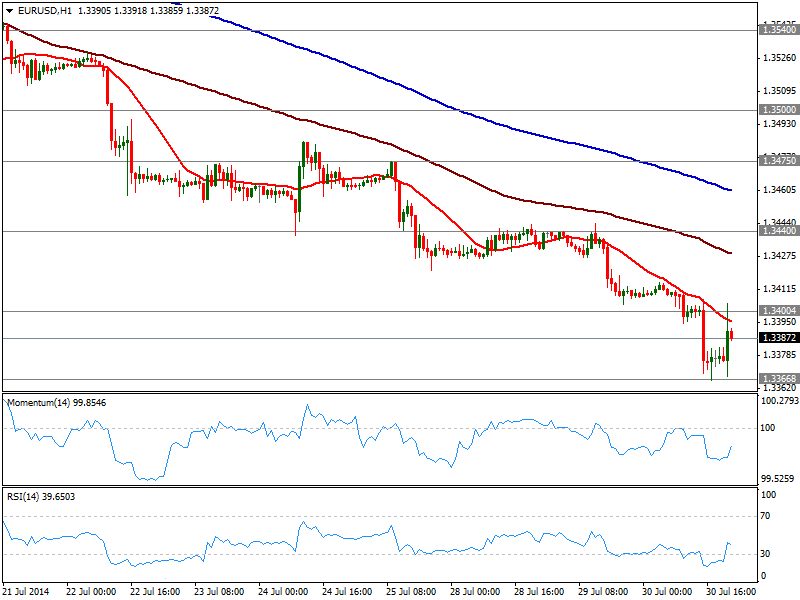
EUR/JPY
Yen crosses were on the losing side for most of the day, despite stocks traded in red along with falling yen, more probably due to weak Japanese numbers, with Retail sales down and unemployment up. FED saved the day among stocks traders, as US indexed trimmed most of their intraday losses, giving support to the falling yen. As for the EUR/JPY, the pair extended up to 137.85 before halting the rally, consolidating now above 137.50 immediate support. The hourly chart shows a strong bullish tone coming from indicators that stand in overbought levels, with moving averages converging right below the 137.00 mark. In the 4 hours chart momentum heads strongly north while RSI losses upward potential in overbought levels, suggesting at least a pause in current bullish run. Further gains need to extend above 137.90 to confirm an upward continuation towards critical 138.40 area, not that easy to accomplish considering EUR self weakness. A break below 137.50 on the other hand, will put the pair back on the bearish side, eyeing a retest of 136.90/137.00 price zone.
Support: 137.50 137.90 136.60
Resistance: 137.90 138.40 138.85 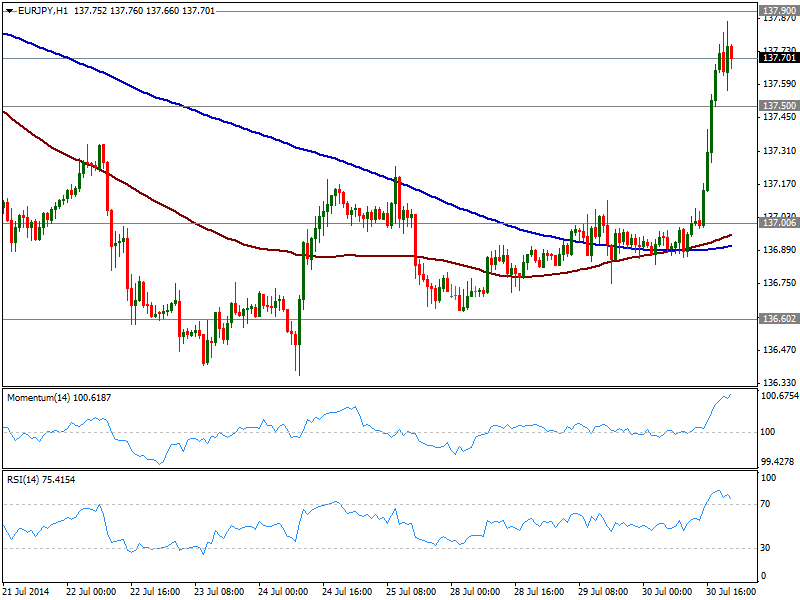
GBP/USD
The GBP/USD continued correcting lower, down to 1.6889 for a brief moment, as the pair recovered quickly above the 1.6900 mark, showing not that much bearish interest at current levels. The hourly chart shows price below a daily ascendant trend line coming from October last year currently around 1.6950 and immediate resistance level, while indicators correct oversold readings, but price remains contained below a bearish 20 SMA. In the 4 hours chart the pair maintains a strong bearish tone that should keep the upside limited, with a break below 1.6890 suggesting further slides in Pound.
Support: 1.6890 1.6850 1.6815
Resistance: 1.6950 1.7000 1.7045 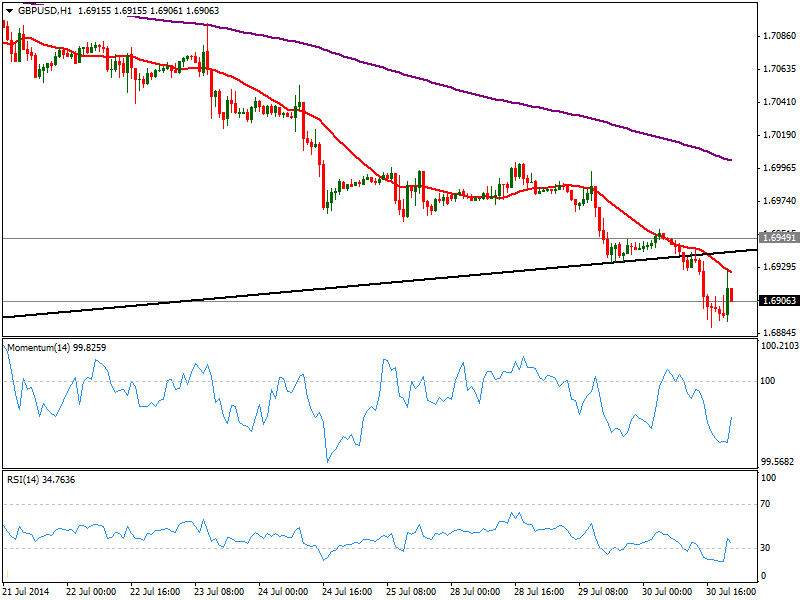
USD/JPY
The USD/JPY trades at levels not seen since early May, having spiked up to 103.08 before pulling back some. Technically, the hourly chart shows indicators turning lower in extreme overbought levels, not surprising considering the pair has been rising steadily for 2 weeks in a row. In the 4 hours chart momentum continues to advance while RSI eases some, both far from suggesting a stronger bearish move. Downside corrections towards 102.35 won’t really affect the trend, and buyers will probably surge on approaches to the level, albeit for the most, some consolidation is expected until Friday’s NFP data.
Support: 102.80 102.35 101.95
Resistance: 103.10 103.40 103.80 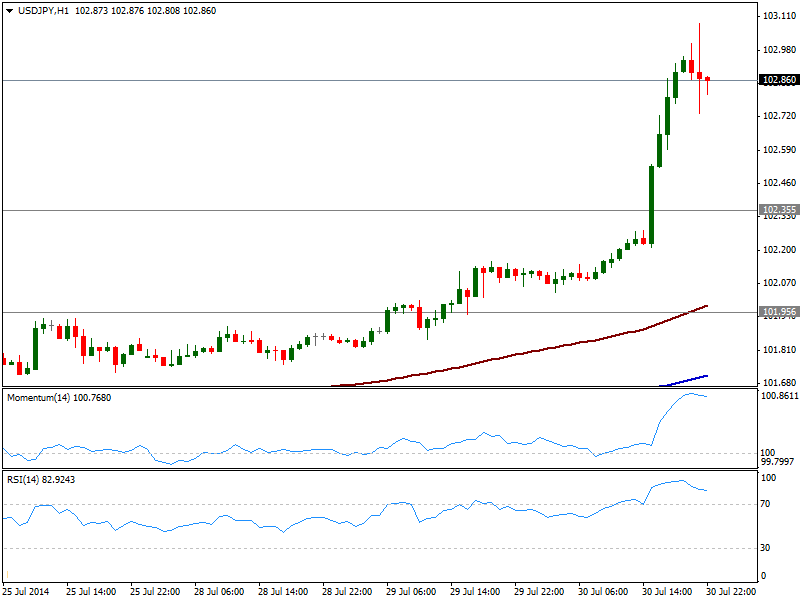
AUD/USD
After falling as low as 0.9302, the AUD/USD is having a hard time to regain 0.9330 former critical support area that contained the downside during the last 2 months. The hourly chart shows 20 SMA turning strongly south capping latest upward spike, and indicators aiming to correct higher from oversold levels. In the 4 hours chart price accelerated below 200 EMA that converges with 20 SMA around 0.9380, while momentum maintains a strong bearish slope: if the pair fails to regain current 0.9330 price zone, the downside is exposed towards 0.9260 strong midterm support, while upward correction will face now selling interest around 0.9370 static resistance zone.
Support: 0.9300 0.9260 0.9220
Resistance: 0.9370 0.9420 0.9460 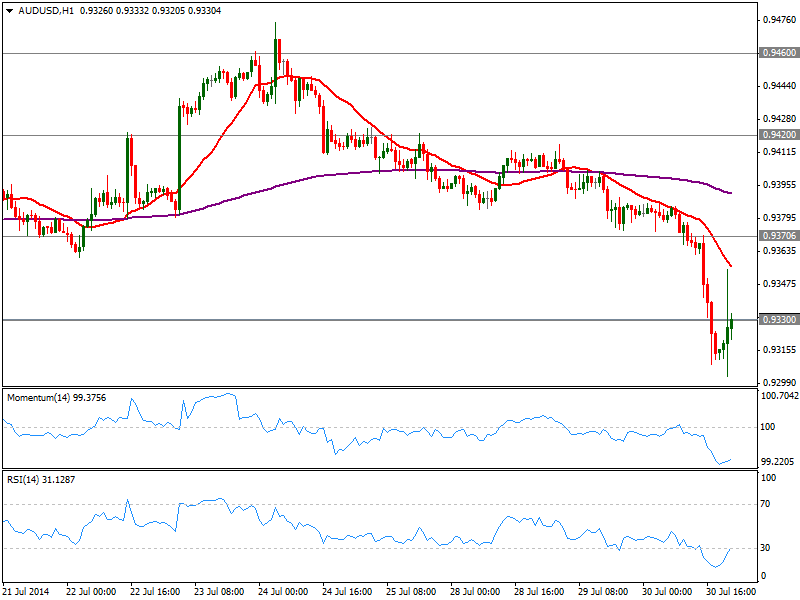
AUD/NZD
Following and over 400 pips rally almost straight, the AUD/NZD edged lower on Wednesday erasing most of its early weak gains, with NZD still among the weakest of the board. The hourly chart shows however the downward move stalled way above the 23.6% retracement of the latest bullish run at 1.0948 immediate support. Price broke below 20 and 100 SMAs, both converging at 1.01000 acting as immediate short term resistance, while indicators head south in negative territory, losing bearish strength near oversold levels. In the 4 hours chart price extended below its 20 SMA, first time since mid July, while indicators turned lower and hover around their midlines showing not enough downward strength. A break below mentioned Fibonacci level will likely anticipate a continued slide, eyeing 1.0900/10 price zone in the short term.
Support: 1.0975 1.0948 1.0910
Resistance: 1.1000 1.1035 1.1070 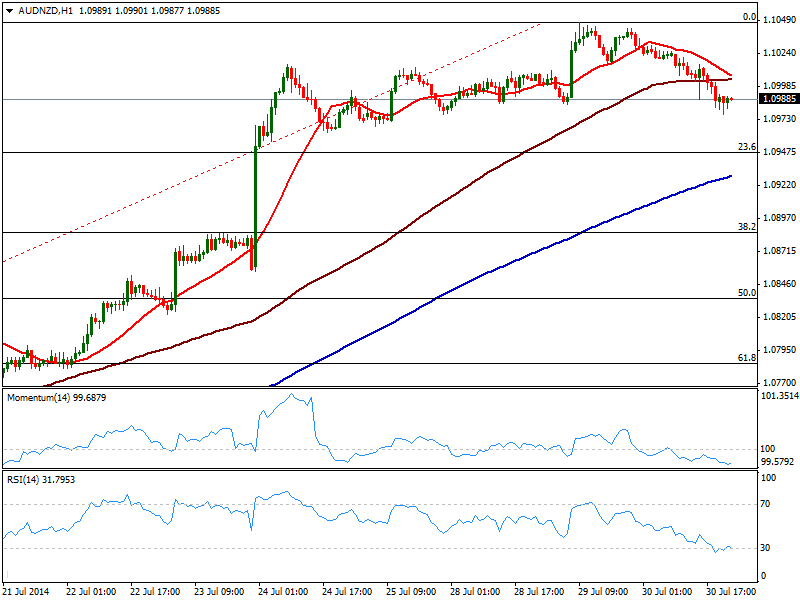
XAU/USD
Gold suffered another setback, posting a lower low for the week of 1291.54, before bouncing some. Nevertheless, the hourly chart maintains a bearish bias with price unable to recover above a bearish 20 SMA, and indicators turning south after touching their midlines. In the 4 hours chart a mild bearish tone is also clear, with 20 SMA standing around 1302.70, static resistance level and daily high, and indicators below their midlines. Renewed selling pressure below 1295 should expose the pair to a retest o past week low around 1287, while if this last gives up, 1274.25 comes next. To the upside, price needs to regain 1309.30, 38.2% of this year rally, to revert current negative tone.
Support: 1294.90 1287.40 1274.25
Resistance: 1302.70 1309.30 1316.30 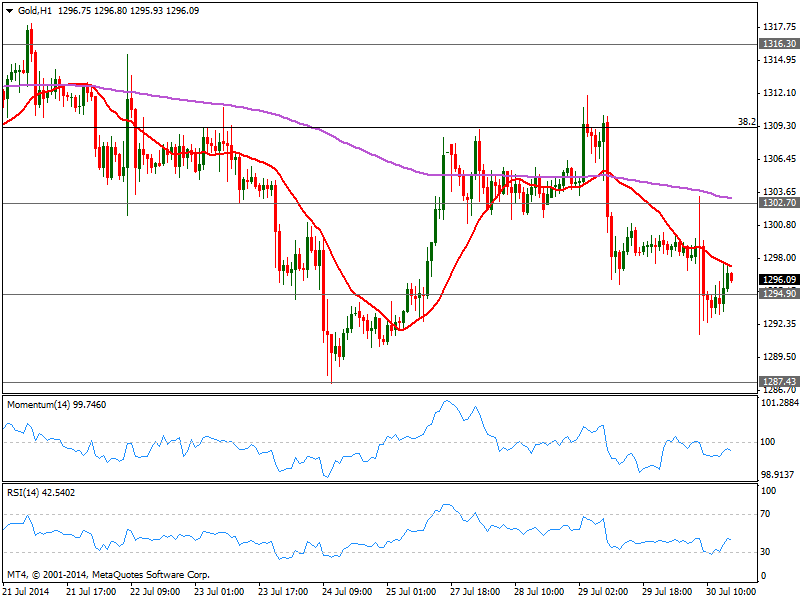
- English (UK)
- English (India)
- English (Canada)
- English (Australia)
- English (South Africa)
- English (Philippines)
- English (Nigeria)
- Deutsch
- Español (España)
- Español (México)
- Français
- Italiano
- Nederlands
- Português (Portugal)
- Polski
- Português (Brasil)
- Русский
- Türkçe
- العربية
- Ελληνικά
- Svenska
- Suomi
- עברית
- 日本語
- 한국어
- 简体中文
- 繁體中文
- Bahasa Indonesia
- Bahasa Melayu
- ไทย
- Tiếng Việt
- हिंदी
Yen Crosses On The Losing Side
Published 07/31/2014, 02:10 AM
Updated 02/21/2017, 08:25 AM
Yen Crosses On The Losing Side

FinFX
3rd party Ad. Not an offer or recommendation by Investing.com. See disclosure here or
remove ads
.
Latest comments
Install Our App
Risk Disclosure: Trading in financial instruments and/or cryptocurrencies involves high risks including the risk of losing some, or all, of your investment amount, and may not be suitable for all investors. Prices of cryptocurrencies are extremely volatile and may be affected by external factors such as financial, regulatory or political events. Trading on margin increases the financial risks.
Before deciding to trade in financial instrument or cryptocurrencies you should be fully informed of the risks and costs associated with trading the financial markets, carefully consider your investment objectives, level of experience, and risk appetite, and seek professional advice where needed.
Fusion Media would like to remind you that the data contained in this website is not necessarily real-time nor accurate. The data and prices on the website are not necessarily provided by any market or exchange, but may be provided by market makers, and so prices may not be accurate and may differ from the actual price at any given market, meaning prices are indicative and not appropriate for trading purposes. Fusion Media and any provider of the data contained in this website will not accept liability for any loss or damage as a result of your trading, or your reliance on the information contained within this website.
It is prohibited to use, store, reproduce, display, modify, transmit or distribute the data contained in this website without the explicit prior written permission of Fusion Media and/or the data provider. All intellectual property rights are reserved by the providers and/or the exchange providing the data contained in this website.
Fusion Media may be compensated by the advertisers that appear on the website, based on your interaction with the advertisements or advertisers.
© 2007-2024 - Fusion Media Limited. All Rights Reserved.