Once again, this week’s economic calendar is very light. There will be plenty of political news and daily doses of FedSpeak. Despite the political stories, I expect the punditry to be asking:
What is happening with housing?
Prior Theme Recap
In my last WTWA (two weeks ago) I predicted a focus on the US Presidential election and the possible implications for financial markets. That was a good guess, with these stories remaining at the forefront of news through two weeks, not just one. Last week included the expected news about the Fed even though the expected news was no real policy change! Doug Short notes the post-Fed S&P 500 rally, as you can see from his excellent weekly chart. (With the ever-increasing effects from foreign markets, you should also add Doug’s World Markets Weekend Update to your reading list).
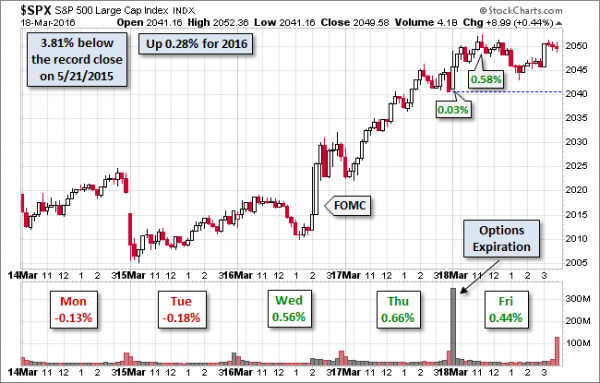
Doug’s update also provides multi-year context. See his full post for more excellent charts and analysis.
We would all like to know the direction of the market in advance. Good luck with that! Second best is planning what to look for and how to react. That is the purpose of considering possible themes for the week ahead. You can make your own predictions in the comments.
This Week’s Theme
The economic calendar is light and the U.S. has a four-day trading week. The President’s trip to Cuba and South America will make news, but probably not financial news. Daily servings of speeches from Fed participants will provide plenty of material for those who always see that subject as most important.
Despite this competition, I expect attention to the role of the housing market in the current economy. Employment remains strong. Auto sales are solid. Retail sales are good. Business investment and housing remain the biggest economic question marks. At one point both were a real drag on economic growth. More recently the effect has been flat rather than negative. With some key data released this week, I expect pundits to be asking: What’s up with housing.
Background
Calculated Risk is the “go to source on housing” according to Paul Krugman. For those who are not fans of Krugman, I have said the same thing many times. Bill called both the top of the housing market in 2006 and the bottom in early 2012. Very few can claim that distinction. His blog has become a top source for coverage of economic news, earning widespread respect. We should be paying attention to his perspective this week.
Viewpoints
Those bearish on the housing market (and often on the economy and stocks in general) frequently cite the following points:
- Increasing housing prices strain the affordability for new buyers;
- Increasing interest rates also hurt affordability;
- Many homeowners are underwater on mortgages and cannot sell or buy;
- Demand is lower because of millennials staying at home or choosing to rent;
- Homes held in foreclosure proceedings or by speculators provide low-priced competition;
- Home sales are low because there is insufficient supply.
Those who are bullish observe the following:
- Interest rates remain at historically low levels, helping affordability;
- The price rebound has helped many to build home equity;
- We can expect increasing purchases from young people;
- The foreclosure and speculative sales are less significant than a few years ago;
- Increased home prices enable some to sell – trading up or even sideways to take new jobs.
As always, I have my own opinion in the conclusion. But first, let us do our regular update of the last week’s news and data. Readers, especially those new to this series, will benefit from reading the background information.
Last Week’s Data
Each week I break down events into good and bad. Often there is “ugly” and on rare occasion something really good. My working definition of “good” has two components:
- The news is market-friendly. Our personal policy preferences are not relevant for this test. And especially – no politics.
- It is better than expectations.
The Good
There was some good news last week, but it was only marginally positive.
- The Fed Decision was – as usual – unpopular with many, but was celebrated by markets. There was no policy change, but the guidance suggested a slower pace of future rate increases. Those who believe that the Fed has no tools left might want to read former chair Bernanke’s latest blog post. (He has some favorable observations about negative interest rates).
- Retail sales missed expectations a bit on the headline, but beat on the core rate. See this week’s Silver Bullet award for more detail.
- Inflation data moved toward a more normal range. The core rate has been about 2%.
- Housing starts climbed. The single family annualized rate was 822K, the best since November, 2007. (Bloomberg)
- Jobless claims remained low at 365K. Staying in this range means that relative few are losing jobs, but we still need job creation.
- JOLTS data showed continued strength in job openings and the quit rate. (BI)
The Bad
Some of the news was negative.
- Housing permits missed expectations dropping 3.1% (Bloomberg).
- Industrial production fell 0.5%.
- Michigan sentiment weakened to 90.0 falling from 91.7 in February and missing expectations. Many observers noted that the level was still strong, but I watch this indicator carefully.

The Ugly
Wild conspiracy rumors. When you read something like this it is best to turn the page. Large-scale conspiracies of central bankers, plunge protectors, or the like have no basis in fact. Too many people would know and find it politically or financially tempting to tell their story. These rumors are most frequently lame explanations by people who have been wrong in their market forecasts. They have to blame someone! Respected media sources should not report such “news” and we should not read it.
The Silver Bullet
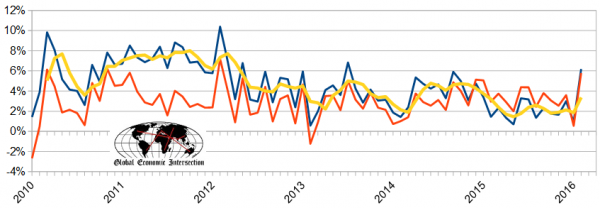
I occasionally give the Silver Bullet award to someone who takes up an unpopular or thankless cause, doing the real work to demonstrate the facts. Think of The Lone Ranger. This week’s award goes to two sources, taking on the same topic but using different approaches. The standard media take is that retail sales have been weak, with little evidence of impact from lower gasoline prices.
Todd Sullivan brings us another post from “Davidson,” who provides consistently fine analysis. (It would be good to see more of him). He notes that many sources confuse nominal and real data showing the chart and the table below:
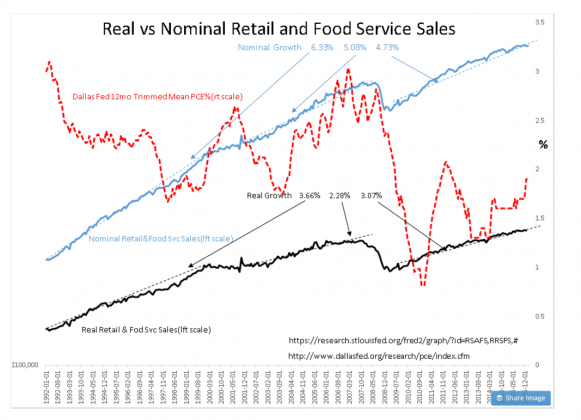
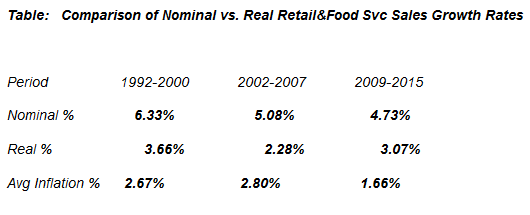
Here is the key takeaway:
Retail and Food Service Sales are at the highest levels ever measured and trending higher. Would you believe that today’s pace is more than 35% higher than our last recovery. Comments in the media would lead you to believe otherwise. Perhaps you have heard a number of recession forecasts. I have heard at least a dozen well known investors say a recession will occur before this year is out. My view differs considerably and remains very positive.
Our co-winner is Steven Hansen of Global Economic Intersection. He prefers rolling averages of unadjusted data, as shown here:
Quant Corner
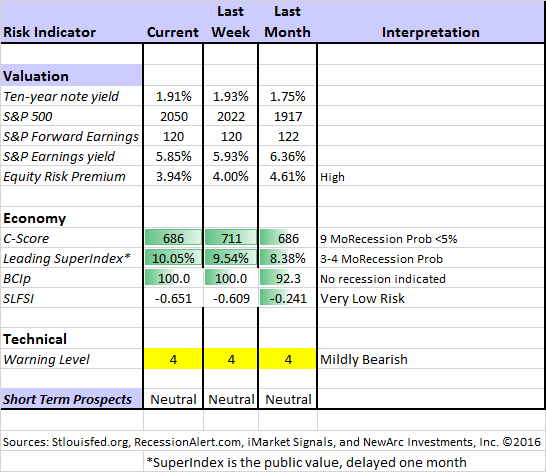
Whether a trader or an investor, you need to understand risk. I monitor many quantitative reports and highlight the best methods in this weekly update. Beginning last week I made some changes in our regular table, separating three different ways of considering risk. For valuation I report the equity risk premium. This is the difference between what we expect stocks to earn in the next twelve months and the return from the 10-Year Treasury note. I have found this approach to be an effective method for measuring market perception of stock risk. This is now easier to monitor because of the excellent work of Brian Gilmartin, whose analysis of the Thomson-Reuters data is our principal source for forward earnings.
Our economic risk indicators have not changed.
In our monitoring of market technical risk, I am now using our new model, “Holmes”. Holmes is a friendly watchdog in the same tradition as Oscar and Felix, but with a stronger emphasis on asset protection. We have found that the overall market indication is very helpful for those investing or trading individual stocks. The score ranges from 1 to 5, with 5 representing a high warning level. The 2-4 range is acceptable for stock trading, with various levels of caution.
The new approach improves trading results by taking some profits during good times and getting out of the market when technical risk is high. This is not market timing as we normally think of it. It is not an effort to pick tops and bottoms and it does not go short.
Interested readers can get the program description as part of our new package of free reports, including information on risk control and value investing. (Send requests to info at newarc dot com).
In my continuing effort to provide an effective investor summary of the most important economic data I have added Georg Vrba’s Business Cycle Index, which we have frequently cited in this space. In contrast to the ECRI “black box” approach, Georg provides a full description of the model and the components.
For more information on each source, check here.
Recent Expert Commentary on Recession Odds and Market Trends
Bob Dieli does a monthly update (subscription required) after the employment report and also a monthly overview analysis. He follows many concurrent indicators to supplement our featured “C Score.”
Georg Vrba: provides an array of interesting systems. Check out his site for the full story. We especially like his unemployment rate recession indicator, confirming that there is no recession signal. He gets a similar result with the twenty-week forward look from the Business Cycle Indicator, updated weekly and now part of our featured indicators.
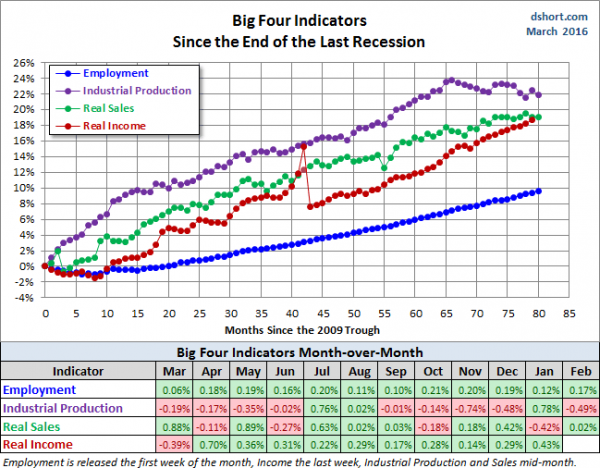
Doug Short: Provides an array of important economic updates including the best charts around. One of these is monitoring the ECRI’s business cycle analysis, as his associate Jill Mislinski does in this week’s update. His Big Four update is the single best visual update of the indicators used in official recession dating. You can see each element and the aggregate, along with a table of the data. The full article is loaded with charts and analysis.
RecessionAlert: A variety of strong quantitative indicators for both economic and market analysis. While we feature the recession analysis, Dwaine also has a number of interesting systems. These include approaches helpful in both economic and market timing. He has been very accurate in helping people to stay on the right side of the market.
Dwaine has introduced a new indicator, using only the timeliest data and a distinct improvement over the ECRI approach. Read the entire post for details and a number of interesting charts.
Bill McBride is still not even on recession watch.
The Week Ahead
We have a huge week for economic data. While I highlight the most important items, you can get an excellent comprehensive listing at Investing.com. You can filter for country, type of report, and other factors.
The “A List” includes the following:
- New home sales (W). Key element of economic health and growth.
- Existing home sales (M). Signals overall market health, while less important for construction.
- Initial Claims (Th). A lot of attention to the recent volatility in the best concurrent news on employment trends.
The “B List” includes the following:
- Durable goods orders (Th). Volatile but important data.
- FHFA housing prices (T). Different segment from the more popular Shiller method, but interesting.
- Crude oil inventories (W). Attracting a lot more attention these days.
- GDP third estimate (F). Old news, no change expected, and announced when the markets are closed.
The election stories will still attract attention. We have FedSpeak every day.
How to Use the Weekly Data Updates
In the WTWA series I try to share what I am thinking as I prepare for the coming week. I write each post as if I were speaking directly to one of my clients. Each client is different, so I have six different programs ranging from very conservative bond ladders to very aggressive trading programs. It is not a “one size fits all” approach.
To get the maximum benefit from my updates you need to have a self-assessment of your objectives. Are you most interested in preserving wealth? Or like most of us, do you still need to create wealth? How much risk is right for your temperament and circumstances?
WTWA often suggests a different course of action depending upon your objectives and time frames.
Insight for Traders
We continue both the neutral market forecast, and the bearish lean. Felix is still 100% invested, catching much of the rebound. The more cautious Holmes avoided the downdraft, but has only signaled a few buys in the last two weeks. For more information about Felix, I have posted a further description — Meet Felix and Oscar. You can sign up for Felix and Oscar’s weekly ratings updates via email to etf at newarc dot com. They appear almost every day at Scutify (follow here). I am trying to figure out a method to share some additional updates from Holmes, our new portfolio watchdog. (You learn more about Holmes by writing to info at newarc dot com.
Dr. Brett explains that many traders are “playing the wrong game.” This happens when you work with a system that does not really fit your skills. I have known many traders who struggle for years in this type of situation.
Insight for Investors
I review the themes here each week and refresh when needed. For investors, as we would expect, the key ideas may stay on the list longer than the updates for traders. Major market declines occur after business cycle peaks, sparked by severely declining earnings. Our methods are focused on limiting this risk. Start with our Tips for Individual Investors and follow the links.
We also have a page (recently updated) summarizing many of the current investor fears. If you read something scary, this is a good place to do some fact checking. Pick a topic and give it a try.
Many individual investors will also appreciate our two new free reports on Managing Risk and Value Investing. (Write to info at newarc dot com).
Other Advice
Here is our collection of great investor advice for this week.
If I had to pick a single most important source for investors to read, it would be Morgan Housel’s post, You May Be A Better Investor Than You Think. He notes that many people unrealistically focus on certain index benchmarks. It is more realistic to look at your own goals. The average investor, either active or passive, doesn’t earn a return even close to the benchmark.
For an investor to earn the returns of the benchmark, they would have to own it continuously, for years on end, without touching shares and reinvesting all dividends. They’d have to sit patiently when markets plunged, never selling out of fear, never needing the cash to fund retirement or a house, and never paying an advisor for advice.
How many investors actually behave that way? Few. Nothing close to the average investor.
Take the Vanguard 500 fund. It’s the closest thing we have to a tradable benchmark – an S&P 500 fund with a negligible fee.
The fund has an average annual return of 6.3% over the last 10 years. But the average investor in the Vanguard 500 fund earned 4.4% a year. The difference is due to money coming into the fund when the market is high and selling when it’s low.
Despite this, you may be doing a lot better than other investors who are making bad picks or trying to time the market.
Stock and Fund Ideas
Dividend stocks. Morningstar reports the top 10 dividend stocks held by their “ultimate stock pickers.” It is an interesting methodology. We own several names on the list and several others are on our watch list for our enhanced yield program.
Taking a look at emerging markets? (I am). Sovereign Man notes that Singapore is one of the richest countries, but has one of the cheapest stock markets.
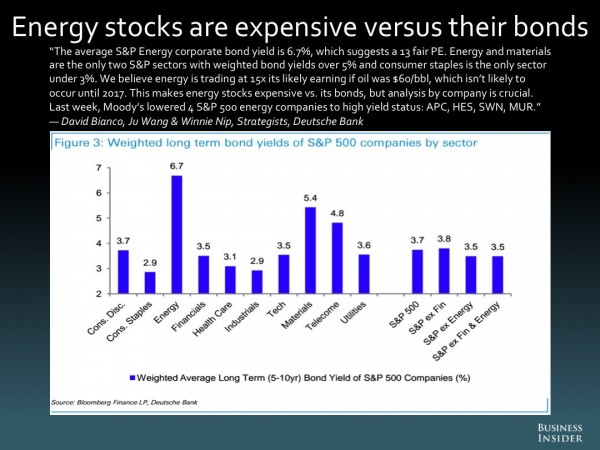
How about energy bonds instead of stocks? David Bianco contributed this idea to BI’s periodic feature on the most important charts. Many are worth checking out (and thanks to reader CS for reminding me about this).
Energy Prices
The International Energy Agency suggests that lower oil production may have created a bottom in prices. The dollar has stabilized and even drifted a bit lower.
Prof. Jeremy Siegel notes that both of these factors might lead to upside surprises in earnings in the coming year – perhaps an increase of 15%.
Watch out for….
Utility stocks. These have been leaders over the last year, driven by momentum rather than fundamentals. Even Felix has owned the group for brief stretches. Value managers see the stocks as significantly overvalued, and it could get much worse if interest rates rise. (The Capital Spectator)
“Smart Beta.” Bailey McCann writes that many such funds are slightly disguised chasers of performance.
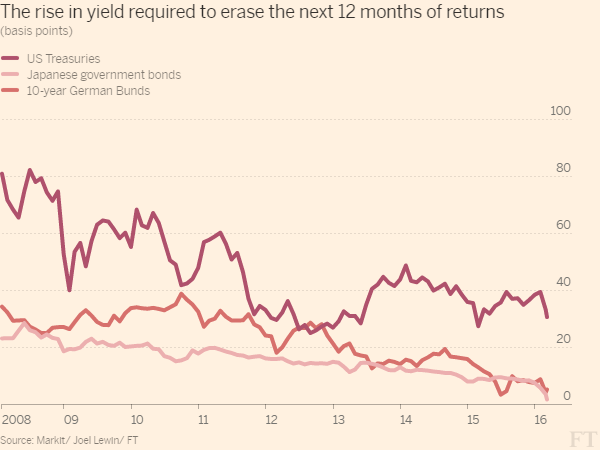
Bonds. It does not take much of an increase in rates to wipe out an entire year of returns. (The FT). AAA corporate bonds in Europe just had the worst twelve months since 1999. The chart tells the story:
Personal Finance
Professional investors and traders have been making Abnormal Returns a daily stop for over ten years. The average investor should make time (even if not able to read AR every day as I do) for a weekly trip on Wednesday. Tadas always has first-rate links for investors in this special edition. There are several great posts, but I especially liked Kyle Moore’s discussion of why investors might benefit from professional advice. After citing examples from various fields, he writes:
What the do-it-yourself approach cannot provide is an objective third party who asks the questions you’ve never considered. This third party, whether golf coach or financial advisor, should be someone who can help you determine your goals, provide a clear path toward those goals, and keep you accountable in your efforts to achieve them.
Final Thoughts
Following Calculated Risk helps you track some indicators that you do not see elsewhere. How about “detached annual lot deliveries.”
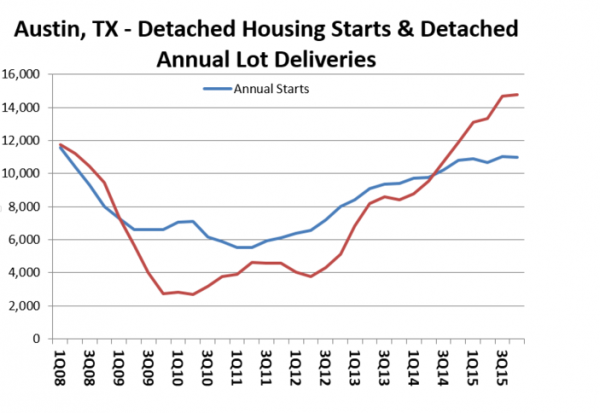
In this post he cites Metrostudy chief economist Brad Hunter, who says that the bullish trend in the lot delivery indicator shows up in several important markets.
I also like the fact that NAHB confidence remains strong. The builders might have some insight into their own business.
Finally, the housing bears seem to have an ever-changing story. Low prices were bad, but so are higher prices. The market was going to be flooded with foreclosure sales. Now there is too little inventory.
It is always best to focus on the major trends rather than short-term blips. The potential for a significant economic contribution in housing is there. The possible drag on the economy seems limited.
Housing could be the sector that gives the economic cycle a further push.
[I am long some homebuilders both personally and for clients].
