If the crowd’s worried about the possibility of rising interest rates, the anxiety isn’t showing up in utility stocks. This interest-rate sensitive corner of equities is comfortably in the lead among US sectors, based on a set of ETF proxies.
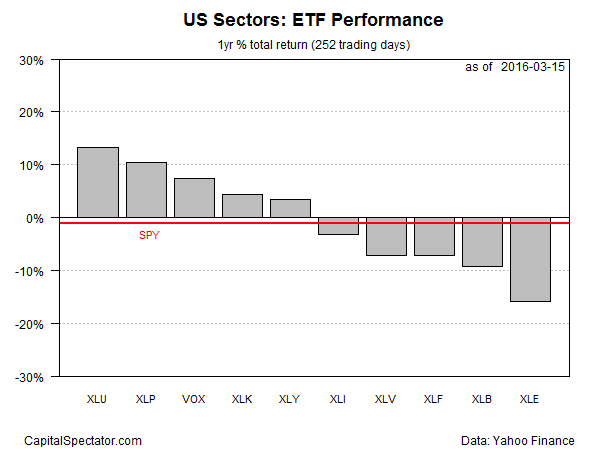
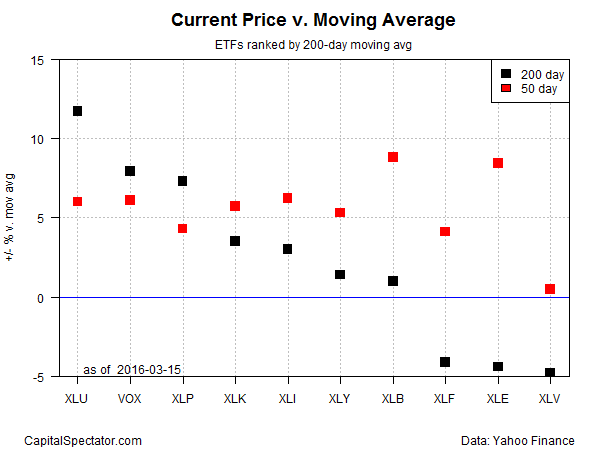
The Utilities Select Sector SPDR (NYSE:XLU) is ahead by more than 13% in total-return terms for the trailing 1-year period (252 trading days) through yesterday (March 15th). The upside bias looks set to continue, based on the bullish momentum of late. The fund’s latest close is well above its 50-day moving average, which is comfortably above its 200-day average.
The ongoing rally in XLU comes as a surprise in some quarters. Late last month, Barron’s ran an article that cited an analyst who wrote that the “sector is now significantly overvalued” based on several metrics. Perhaps, but that hasn’t stopped the bulls from pushing prices even higher. Since the article appeared on February 27th, XLU has climbed nearly 5% through yesterday’s close.
XLU’s strong rise for the trailing one-year period looks even more impressive when compared with the 1% loss for US equities generally via the trailing 252-trading-day return for the SPDR S&P 500 (NYSE:SPY). The contrast is especially dramatic when utilities are ranked next to the beleaguered Energy Select Sector SPDR (NYSE:XLE), which remains deeply in the red for the one-year comparison despite a rally in recent weeks.

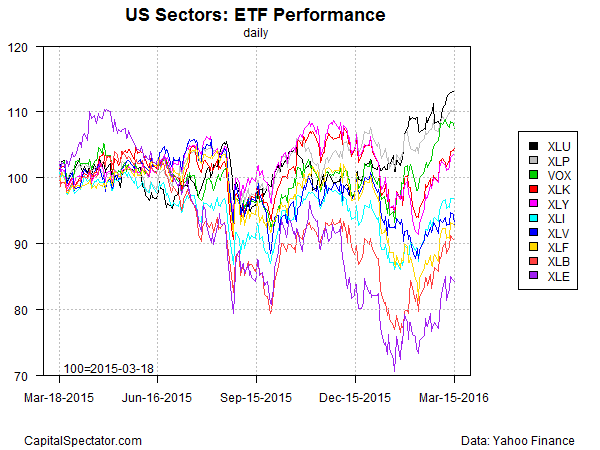
Reviewing the performance histories of the sectors over the past year further accentuates XLU’s strength in relative and absolute terms. Although everything has popped lately, the utility sector is the clear leader so far in 2016 (black line at top of chart below).

XLU’s technical strength also stands apart when ranked by moving averages among the sector ETFs. Indeed, the utilities fund closed yesterday at nearly 12% above its 200-day moving average—a sizable gap over the rest of the field.

The rear-view mirror still looks bullish for utilities via a price-momentum prism, but some analysts continue to warn that the fundamentals look stretched.
“Utilities are trading at a 10% premium to their long-term average price/earnings ratio,”
says Sam Stovall, managing director at S&P Global Market Intelligence, via Ticker Tape.
“If recession is still a possibility, investors will continue to focus on defensive sectors. And at the same time, the Fed probably won’t be raising rates aggressively should the economy slow.”
