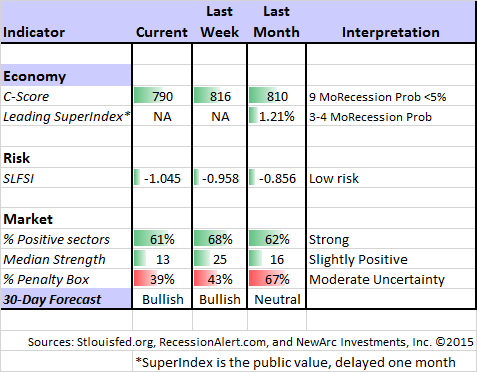
What happens when the economic calendar is light and the market volatile? Pundit Paradise! Last week set the table. This week is the pre-game. Next week the FOMC will decide and explain. For those who think it is all about the Fed, this week’s question is obvious:
Is Good Economic News Bad for Investors?
Prior Theme Recap
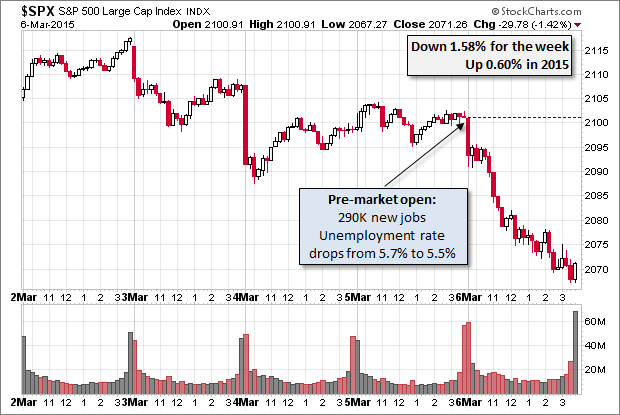
In last week’s WTWA I predicted that each morsel of economic data would be parsed through the lens of potential changes in Fed policy. This may be the most accurate theme prediction I have ever made. Weak economic data during the week had little effect. The jobs report alone, despite some weak spots, was strong enough to spark rate hike speculation.
It even happened as I hypothesized – HFTs responding to computer parsing of the data (8:31 AM), delayed in the announcement (8:32 AM) by “weather.” Traders joined in (8:33 AM). Then bloggers. Then pundits.
Doug Short’s pictures are always worth a thousand words, but you should join me in reading his weekly market snapshot where the words are also great. This week he notes: “But good economic news freaked out the market, with pundits jabbering about the increased odds of a Fed rate hike.”
Feel free to join in my exercise in thinking about the upcoming theme. We would all like to know the direction of the market in advance. Good luck with that! Second best is planning what to look for and how to react. That is the purpose of considering possible themes for the week ahead.
This Week’s Theme
The upcoming week is very light on data, but rich in pundit potential. Since airtime and news space must be filled with “explanations” of any market move, there is a job to be done. Since we have exactly one day of (probably) positive economic data and the market declined, we had better jam those two facts together and start drawing conclusions. There is an open week for a favored sport — Fed speculation. The key question will be:
Is Good Economic News Now Bad for Investors?
Yes, you can think of it as last week’s theme, Part II, but that is the reality. It may well extend another week for Part III.
The Viewpoints
Let me split the viewpoints for this week into what the Fed should do and what difference it makes.
Recommended/Likely Policy
- Time for a rate increase. There is growing sentiment that extraordinary policy involves unknown risks with little gain. Former Dallas Fed President Bob McTeer says, Let ‘Er Rip, Janet; Let’s Get It Over With
- Robust Jobs Report increases odds for rate increase. (Jon Hilsenrath).
- Increase more likely, but pace will be slow. Tim Duy notes the significance of wage gains.
Effect
- Market reflects strong jobs report (Reuters).
- Rate hikes will be a disaster for investors. Economic data have been very weak. Pension Partners has the list of “misses” and the Citigroup (NYSE:C) Surprise Index. Their conclusion is that the “bad news is good news” crowd might be silenced if rate increases occur in the face of economic weakness.
- Good news will push markets higher (“Davidson” via Todd Sullivan).
I continue my mantra, “Buy stocks! Buy Stocks! Buy Stocks!” A rising economy lifts all ships. Yes, we will want to get out before the tide goes out, but the tide continues to come in. Based on economic indicators which no one seems to pay attention to these days, we should have up to 24mos of warning of a pending market top.
Current data provides confidence in the view that there is no economic peak visible for at least 12mos-24mos and subsequently no market top in that time frame.
- Stocks usually rise both immediately before and immediately after rate hikes. (MarketWatch).
- It makes no difference. Scott Grannis did not find the jobs report to be that strong, but also sees the policy significance to be minor.
February jobs growth was stronger than expected, confirming that labor market conditions have improved. But not by much. The economic outlook has not improved dramatically, it’s simply gotten a bit better. Whether the Fed tightens one month earlier than expected as a result of this number is almost a trivial matter. Short-term rates are not going to be problematic for the economy for a long time, no matter what. I see no reason the economy couldn’t continue to (very slowly) improve even as the Fed raises short-term rates a couple of hundred basis points over the next two years or so (that’s a forecast drawn directly from the bond market’s current expectations).
As always, I have some additional ideas in today’s conclusion. But first, let us do our regular update of the last week’s news and data. Readers, especially those new to this series, will benefit from reading the background information.
Last Week’s Data
Each week I break down events into good and bad. Often there is “ugly” and on rare occasion something really good. My working definition of “good” has two components:
- The news is market-friendly. Our personal policy preferences are not relevant for this test. And especially – no politics.
- It is better than expectations.
The Good
There was some good news last week.
- ISM services index was 57.1 slightly better than expectations and a marginal positive.
- China’s non-manufacturing PMI showed a slight rebound. There is a lot of attention on Chinese growth, now targeted at 7% instead of 7.5%. We all want to find helpful data. (GEI).
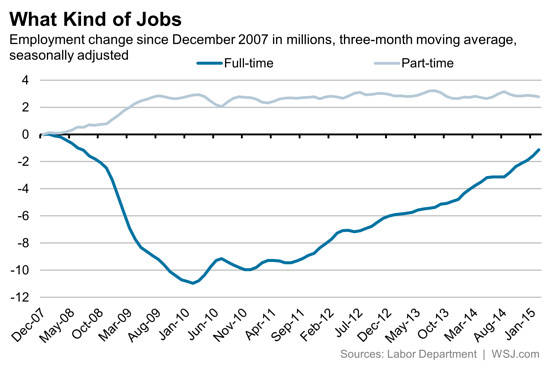
- Employment improved. This is a test of my rules about good equaling “market friendly.” The current theme is how to interpret good economic news. For now, let us take the improved employment picture at face value. The consensus of economists was “A Strong Report.” The WSJ has ten good charts capturing the improvement. Here is a good one:
There is a tendency in the commentary to fear automation. Remember the Luddites? (Walter Isaacson in the FT).
The Bad
There was plenty of mildly discouraging economic news.
- Personal income and spending were both slightly weaker than expected.
- The ISM manufacturing index fell to 52.9. This was also slightly below expectations, but consistent with current GDP estimates.
- Auto sales were somewhat disappointing, especially from Ford. Some are noting exceptionally bad weather.
- Earnings expectations further softened. FactSet reports likely year-over-year declines for the first half of 2015. On the plus side, the forward earnings growth of the NASDAQ remain in line with historical averages. The energy effect has been important as Brian Gilmartin emphasizes in his excellent weekly analysis.
- Short-term leading indicators weaken. New Deal Democrat’s excellent weekly column includes plenty of data on indicators you might otherwise miss. This week he notes a convergence of some coincident and short leading indicators, including shipping, steel production, retail, commodity prices, credit spreads, and housing.
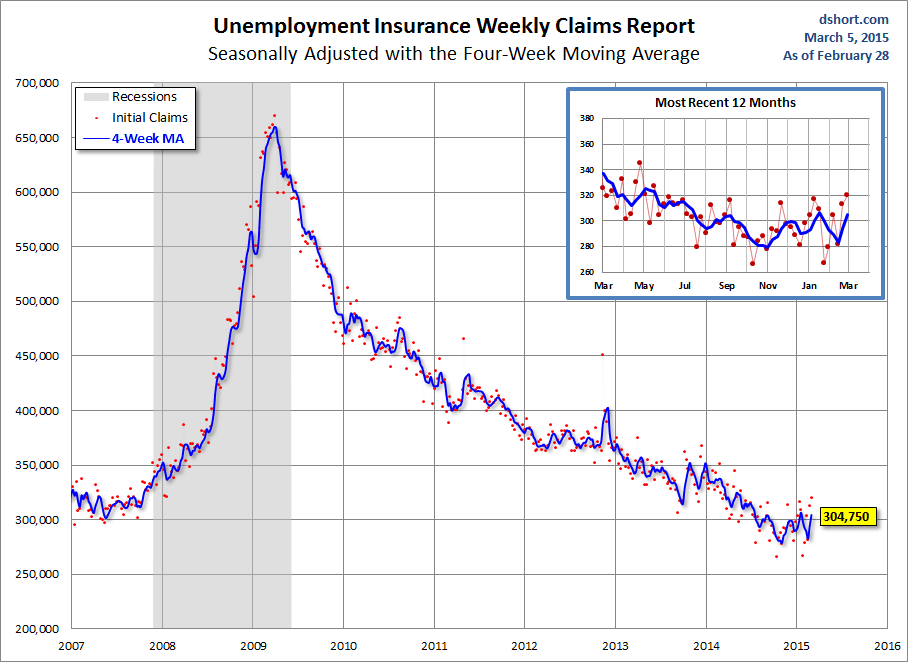
- Jobless claims rose again to 320K. The four-week moving average is now almost 25K over the recent low, so the increase is not just noise. Doug Short captures the long and short term trends in this chart:
The Ugly
Utilities. The SPDR Select Sector - Utilities ETF (NYSE:XLU) was down 3% on Friday alone and over 10% in the last few weeks. With a PEG ratio of over 2.7, there is plenty of risk remaining in a group sought out for safety. If the U.S. 10-Year yield goes to 3%, where it started last year, expect utilities to drop another 20%.
The Silver Bullet
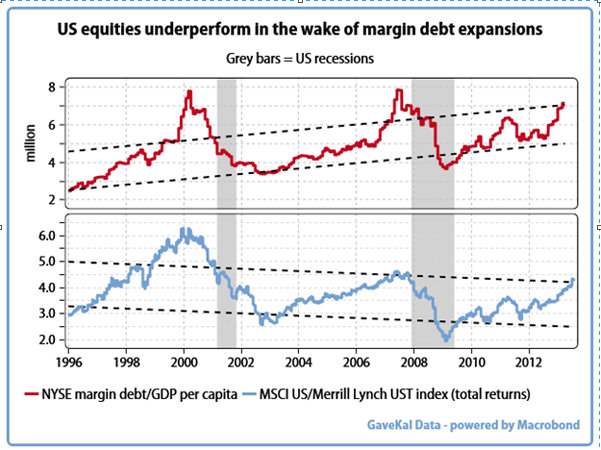
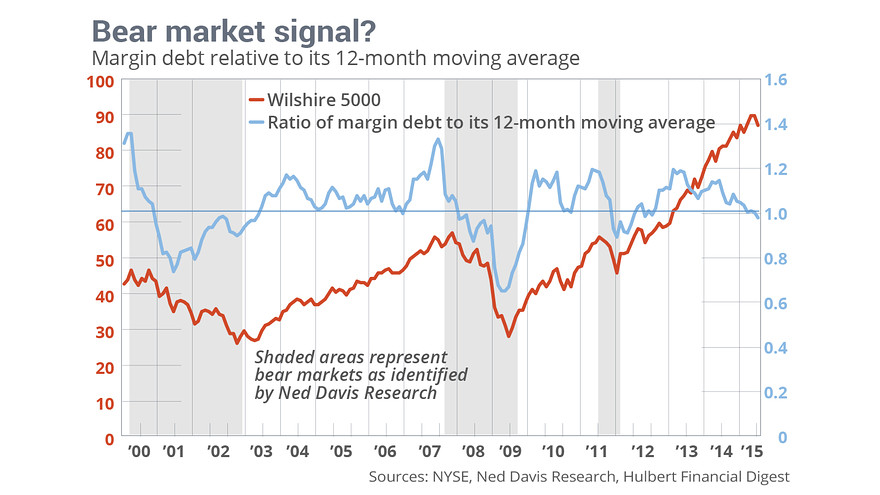
I occasionally give the Silver Bullet award to someone who takes up an unpopular or thankless cause, doing the real work to demonstrate the facts. Think of The Lone Ranger. No nomination this week, although the field is fertile. Try this one on margin debt:
It is threatening if it goes up –
And also if it goes down….
Quant Corner
Whether a trader or an investor, you need to understand risk. I monitor many quantitative reports and highlight the best methods in this weekly update. For more information on each source, check here.
Recent Expert Commentary on Recession Odds and Market Trends
Bob Dieli does a monthly update (subscription required) after the employment report and also a monthly overview analysis. He follows many concurrent indicators to supplement our featured “C Score.”
RecessionAlert: A variety of strong quantitative indicators for both economic and market analysis. While we feature the recession analysis, Dwaine also has a number of interesting market indicators. This week he notes an increase in his combined measure of economic stress, although the levels are still not yet worrisome.
Doug Short: An update of the regular ECRI analysis with a good history, commentary, detailed analysis and charts. If you are still listening to the ECRI (three years after their recession call), you should be reading this carefully. Doug has the latest interviews as well as discussion. Also see Doug’s Big Four summary of key indicators.
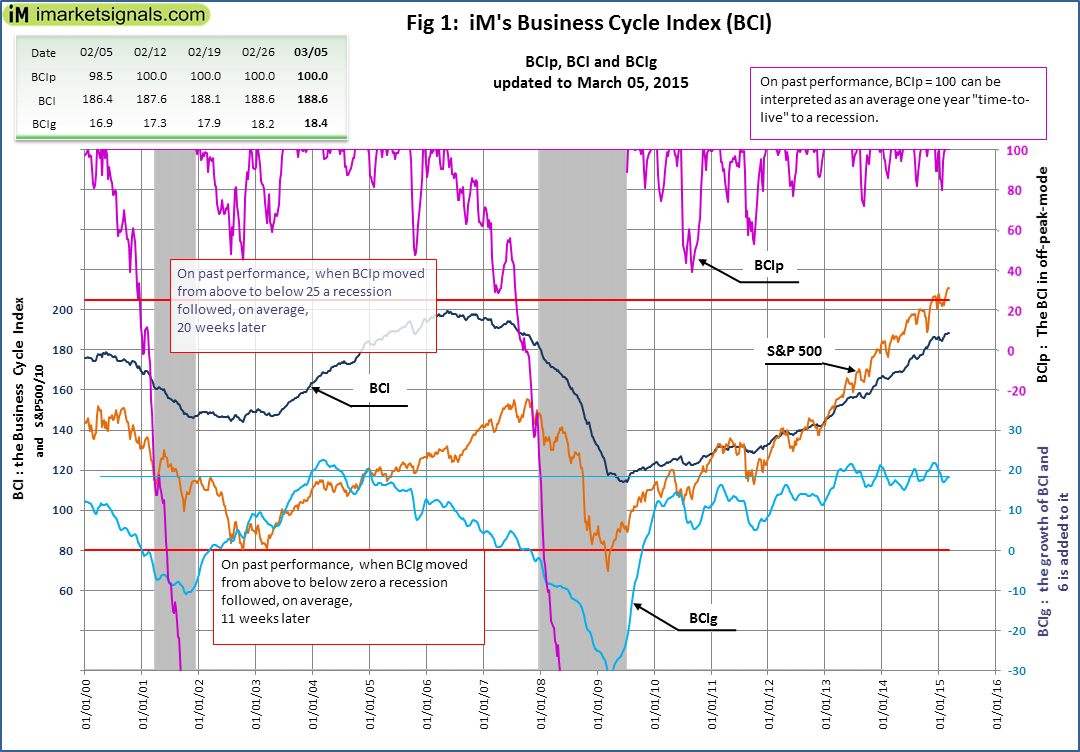
Georg Vrba: has developed an array of interesting systems. Check out his site for the full story. We especially like his unemployment rate recession indicator, confirming that there is no recession signal. He gets a similar result from the Business Cycle Indicator (chart below). Georg continues to develop new tools for market analysis and timing, including a combination of models to do gradual shifting to and from the S&P 500. I am following his results and methods with great interest. You should, too.
Worried about CAPE and other valuation model warnings? Dorsey Wright explains that even the extreme readings on these measures have not been helpful:
Pretty shocking results. If you can’t even successfully identify overvalued markets when a market is in the 99th valuation percentile, then why even pay any attention to valuation measures at all? If someone wants to be bearish, there is always some seemingly plausible reason and CAPE valuation measures are an often-cited reason. However, Gray’s study is a solid takedown of the idea that CAPE can be effectively used as a way to get out of the market at the right time.
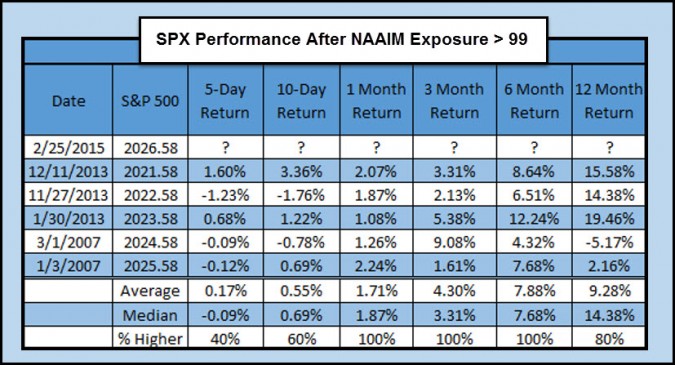
What about bullish sentiment? I regularly cite sentiment in the standard way, since we respect the general market opinion for weekly news. Meanwhile, the longer time frame often differs. Chris Kimble explains that bullish sentiment might not be contrarian. Quelle surprise! Active managers might know something after all.
Reader Question
I get lots of questions both in the comments and via email. I answer as many as possible and always wish I could do better. Sometimes I get something that seems both timely and relevant to many. This week there is special interest in whether there is currently an “earnings recession” and what that might mean for the market.
Part of the attention comes from James Kostohryz, who writes about the earnings recession and asks, “Is the Stock Market in Danger?”
I have favorably cited his work in the past and I am a regular reader. I agree with certain key points, including the following:
- The importance of forward earnings estimates;
- The recent decline in these estimates; and
- The evidence that markets and forward earnings generally move in a similar direction, especially if you are flexible about timing
With that in mind —
I need to do an update about causal modeling. Consider the following facts, probably true but carefully invented for today’s post. There is a very strong correlation between Illinois road salt consumption and the number of toll way accidents. The relationship persists over many years. This leads some in the legislature to suggest that our financially troubled state slash spending on road salt to cut accidents. (Don’t laugh! The Wisconsin Legislature featured a Senate debate on the 55 MPH speed limit. One side contended that hitting a deer at a high speed would be much worse. The other pointed out that if you had been driving faster you would be gone before the deer got there).
In many situations correlations are explained by a third variable. Winter snowfalls create both treacherous conditions and the need for salt.
In financial analysis there are hundreds of variables that move with general economic conditions. It is more important to focus on recession risks (the equivalent of winter in the example) as I do each week. If forward earnings do not grow, it will generally weigh upon future stock prices. The information in well-known and reflected in current prices. (See also Ben Levisohn in Barron’s).
The Week Ahead
It will be a light week for economic data.
The “A List” includes the following:
- Initial jobless claims (Th). The best concurrent news on employment trends, with emphasis on job losses.
- Retail sales (Th). Any February boost from lower gas prices?
- Michigan sentiment (F). A good concurrent read on employment and spending, with some leading qualities.
The “B List” includes the following:
- JOLTS report (T). Important for interpreting structural unemployment – important to the Fed, but poorly understood by markets.
- PPI (F). Inflation data is of lesser significance until we see several months at higher levels.
- Crude oil inventories (W). Maintains recent interest and importance.
The Fed will report the second round of stress test results showing which banks may declare dividends and do buybacks. There is a little FedSpeak on Monday, but then we have a quiet period in front of the March 17 FOMC meeting.
How to Use the Weekly Data Updates
In the WTWA series I try to share what I am thinking as I prepare for the coming week. I write each post as if I were speaking directly to one of my clients. Each client is different, so I have five different programs ranging from very conservative bond ladders to very aggressive trading programs. It is not a “one size fits all” approach.
To get the maximum benefit from my updates you need to have a self-assessment of your objectives. Are you most interested in preserving wealth? Or like most of us, do you still need to create wealth? How much risk is right for your temperament and circumstances?
My weekly insights often suggest a different course of action depending upon your objectives and time frames. They also accurately describe what I am doing in the programs I manage.
Insight for Traders
Felix has continued a “bullish” posture for the three-week market forecast, but it is a close call. The data have worsened a bit. There is modest uncertainty, reflected by the percentage of sectors in the penalty box. Our current position is still fully invested in three leading sectors, and we remain aggressive. For more information, I have posted a further description — Meet Felix and Oscar. You can sign up for Felix’s weekly ratings updates via email to etf at newarc dot com.
Those who want to test their skills should check out the hedge fund manager contest at Scutify.com and compete for over $20,000 in cash and prizes. It is plenty of fun and the risk/reward is excellent!
Insight for Investors
I review the themes here each week and refresh when needed. For investors, as we would expect, the key ideas may stay on the list longer than the updates for traders. Major market declines occur after business cycle peaks, sparked by severely declining earnings. Our methods are focused on limiting this risk. Start with our Tips for Individual Investors and follow the links.
We also have a new page summarizing many of the current investor fears. If you read something scary, this is a good place to do some fact checking.
My bold and contrarian prediction for 2015 – that the leading sectors would lose and the laggards would win – still looks promising. I also see plenty of time left in this economic and stock cycle.
Other Advice
Here is our collection of great investor advice for this week:
Personal Finance
Last week I posted some highlights from the annual Berkshire Hathaway letter. This week there were some excellent “reviews.” I especially like the quotes and quips and these interactive annotations of the report. Have fun!
Personal finance Wednesday at Abnormal Returns. Great ideas and links.
Stock and Sector Ideas
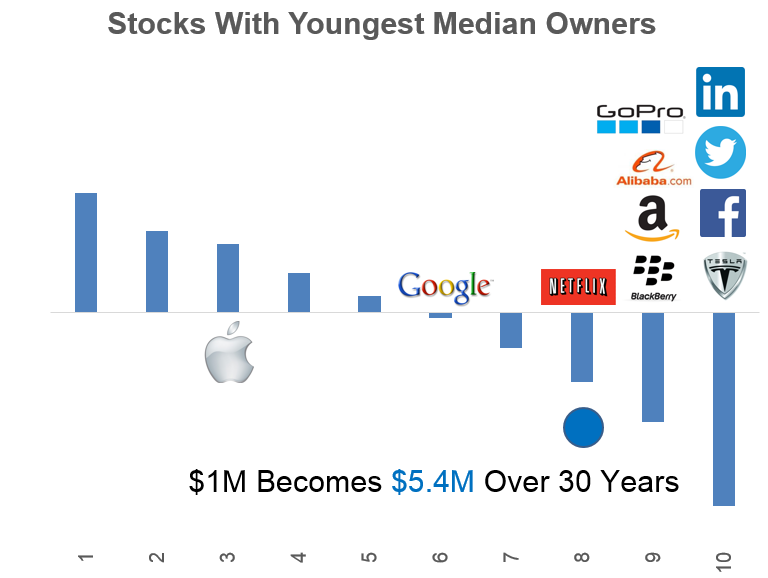
Millennial investors own the wrong stocks. Patrick O’Shaughnessy explains, comparing holdings of this age group with that of older investors. Here is the first portfolio:
- Watch out when buying dividend funds. (Barron’s).
- Transportation stock ideas.
- Chuck Carnevale uses his excellent tools for an analysis of the dangers in many utility stocks. Check out his many examples as well as the overall analysis.
Market Outlook
Sell now if you need your money from stocks within the next eight years. (Hussman).
Energy
Look for oil prices in the $65-70 range. (UBS via MarketWatch)
Bargain ideas from Oakmark funds.
Final Thought
Sometimes my final thought is worth a repeat. Last week’s was especially accurate. One of my regular themes is the difference in time frames between traders and investors.
Traders parse everything through the lens of Fed policy. HFT algorithms look for key words and front-run the humans. Human traders do the same thing – but more slowly. The blog posts hit, “explaining” why the Fed will change course.
If you are a trader, you have a tough job competing in this game.
Investors are free to ignore the immediate psychological reaction and to consider the fundamentals. Here are the most important two points:
The exact timing of the first Fed rate increase does not matter. There is a difference between tight monetary policy and slightly less accommodative policy. Markets do quite well in the early stages of rising rates, especially when starting from a low initial point. This will be ignored by many who will invoke “Don’t fight the Fed.” This will be the fundamental battleground between traders and investors, bears and bulls, and various political types – perhaps lasting for years.
The end of the business or stock market cycle is not imminent. Bull markets do not die of old age. Investors should understand that this one might run for many years. There are many famous and successful investors who have explained this, but I especially like this year-old analysis from Leon Cooperman. It happened just as a famous technical analyst noted that markets were at “an inflection point” not unlike the 1929 crash. See also David Rosenberg. It is easy to find many others top analysts explaining this.
This week I will add why I am not very impressed by the combination of weak economic data and Fed policy. The data are not really that weak. I do not cite the Citi Surprise Index for a reason, documented each week in this series.
- A surprise depends upon the level of current expectations. If it is really high, I do not worry about a small miss. The same is true in the other direction of course.
- The list includes many indicators that are unimportant. If you look at the list in the post, it is all about quantity. The major indicators that we feature tell a different story.
In the richness of time – probably not very long – the market will recognize the best values. The continuing gradual economic growth favors mid to late-cycle stocks. The biggest risk is (ironically) in the sectors where many have sought safety.
One More Idea
Columbo was a favorite of mine, so let’s consider one last idea. It would be a big time saver for us all. We now have many years of full transcripts for Fed meetings. We know that hundreds of people have this information and there is no potential for deception. We can see exactly what was discussed five years ago, often including the current participants. (Yellen’s 2009 participation looks pretty good, BTW). For serious research, you can check out five key takeaways from 2009. For fun, you can check out the “laugh track” of humor from the FOMC meetings from the grim background of 2009. I am having trouble selecting from these knee-slappers, although I did send the Oxford T-Shirt joke to some friends of that persuasion. Enjoy on your own.
But here is the time-saving idea: Anyone who wants to speculate on what the Fed is thinking must include some actual evidence from past transcripts. If, for example, you want to suggest that the Fed “wants a market correction” (you can’t make this stuff up) then you have to find at least one historical example where some participant raised that idea. Otherwise, shut up!

