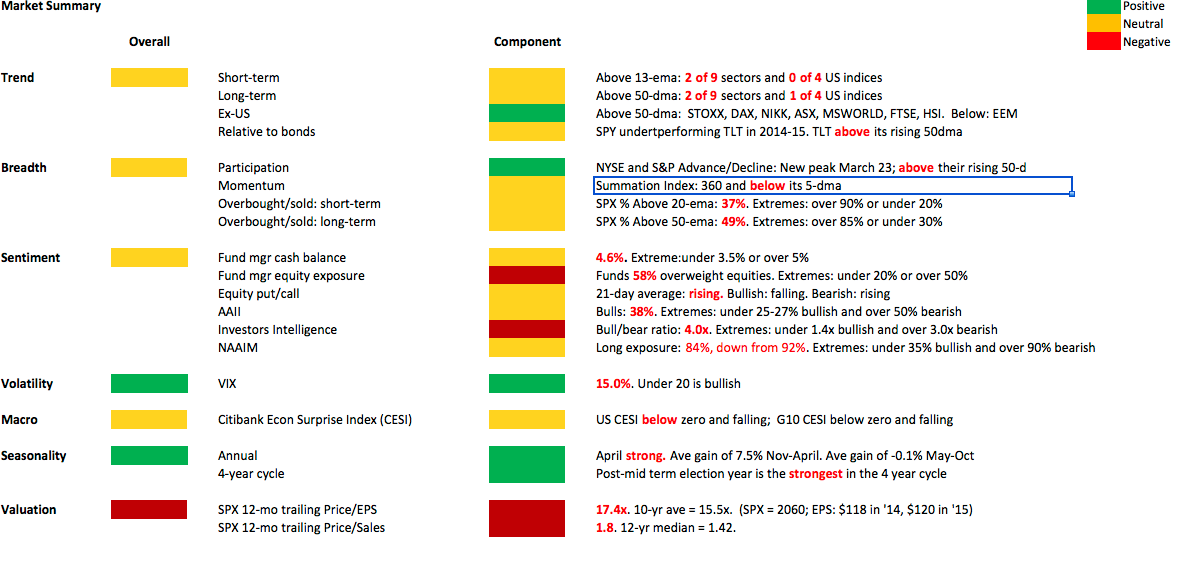
Summary: The largely trend-less environment of the past four months continues. Despite the fall this week, US equities are not oversold and sentiment is still heady. This suggests that a rally early in the week would likely fail. While April is one of the best months of the year, the first half of the month has been weak. If this pattern continues this year, there would likely be a more attractive entry point mid-month.
US indices gave back all of their prior week's gains. For the week, S&P 500, Dow Jones 30 and Russell 2000 fell 2% and NASDAQ lost 3%.
Europe was also down more than 2% and emerging markets lost 1.5%.
Let's review the recent market action.
In December and January, SPX lost 4-5% on four different occasions. In between, it gained the same amount. Each potential break out and breakdown was reversed.
Then in February, SPX rose three weeks in a row, gaining more than 7%, during which it never once touched its rising 13-ema. Instead of consolidating and then adding to those gains, it fell the next three weeks in a row.
But there was no follow through to the downside either. A week ago, SPX reversed and gained nearly 3%. But instead of adding to those gains, it promptly fell 4 days in a row this week.
After all of this, SPX is exactly flat from December 1st nearly four months ago. There is, in short, almost trend to speak of.
Our view a week ago was that a true test of market character had arrived. Aside from RUT, none of the other US indices were overbought. If there was upside ahead, the indices would show strength by becoming and remaining overbought. Instead, the markets fell hard. This would seem to indicate that the ranged market environment of the past four months will continue. You can read a similar assessment by Brett Steenbarger here.
So, what happens next?
First of all, recognize that this is a market that reverses hard just when it looks like it might break out higher and breakdown lower. There were no visible extremes at the end of last week, but they could present themselves within a day or two.
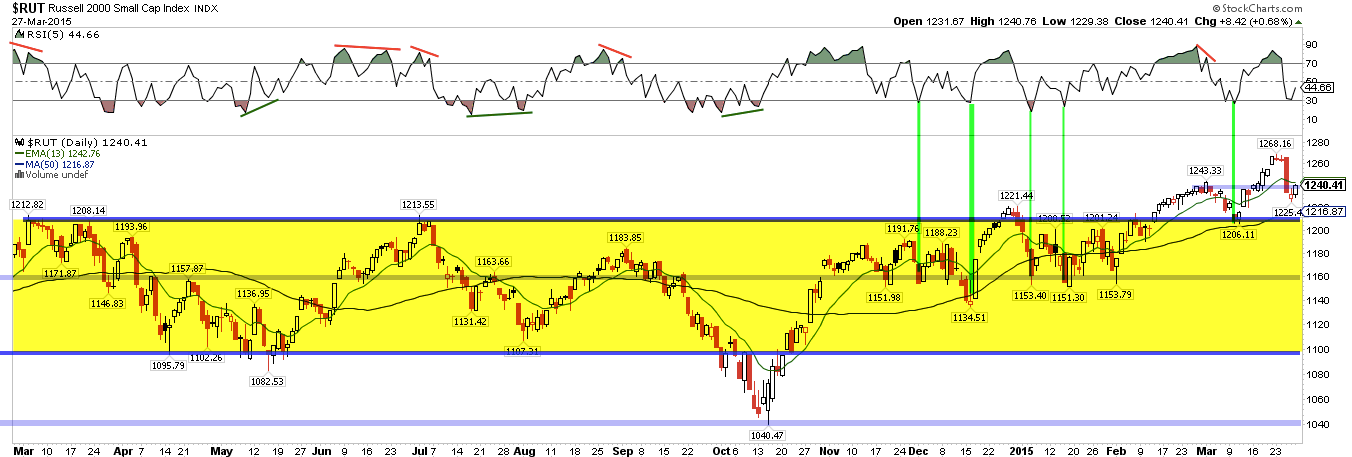
Of the US indices, RUT looks the healthiest; it was the only index to make a higher high. Its 50-dma is rising and its RSI is oversold, a set up for a bounce each time since early December (green lines). But the big 2% loss on Wednesday suggests it could easily drop to its 50-dma (1216) which is now at the top of the 1 year trading range (yellow). That should be solid support.
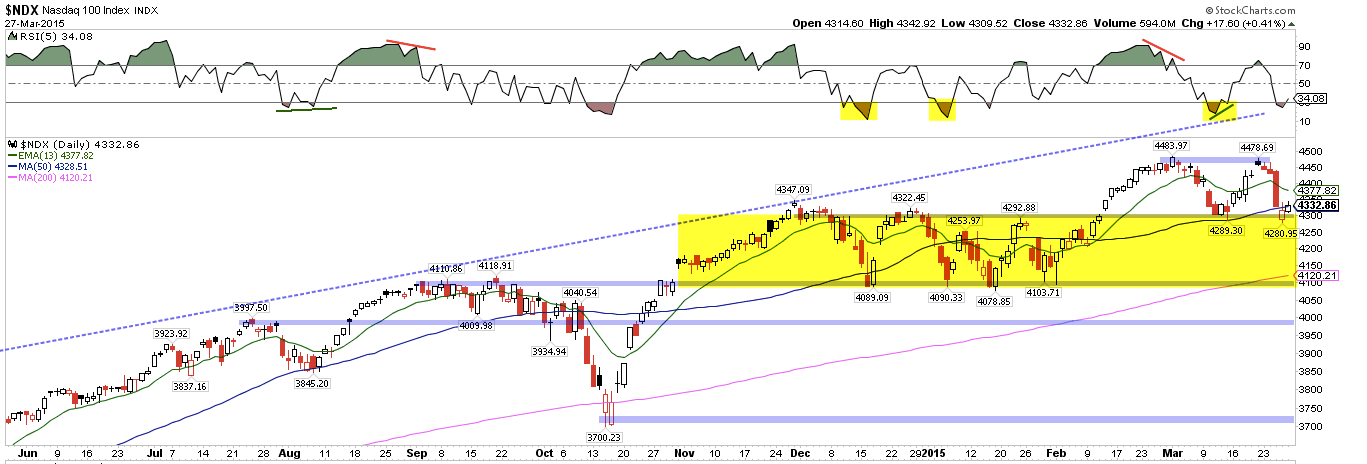
NDX closed the week under its 50-dma. There is also a lower high and lower low now. Its RSI has previously become more oversold at the lows than it is now. In short, NDX looks tenuous, but the set up is a trade long with a stop below Thursday's low (1% lower), a bet that the former trading range (yellow shading) will hold as support.
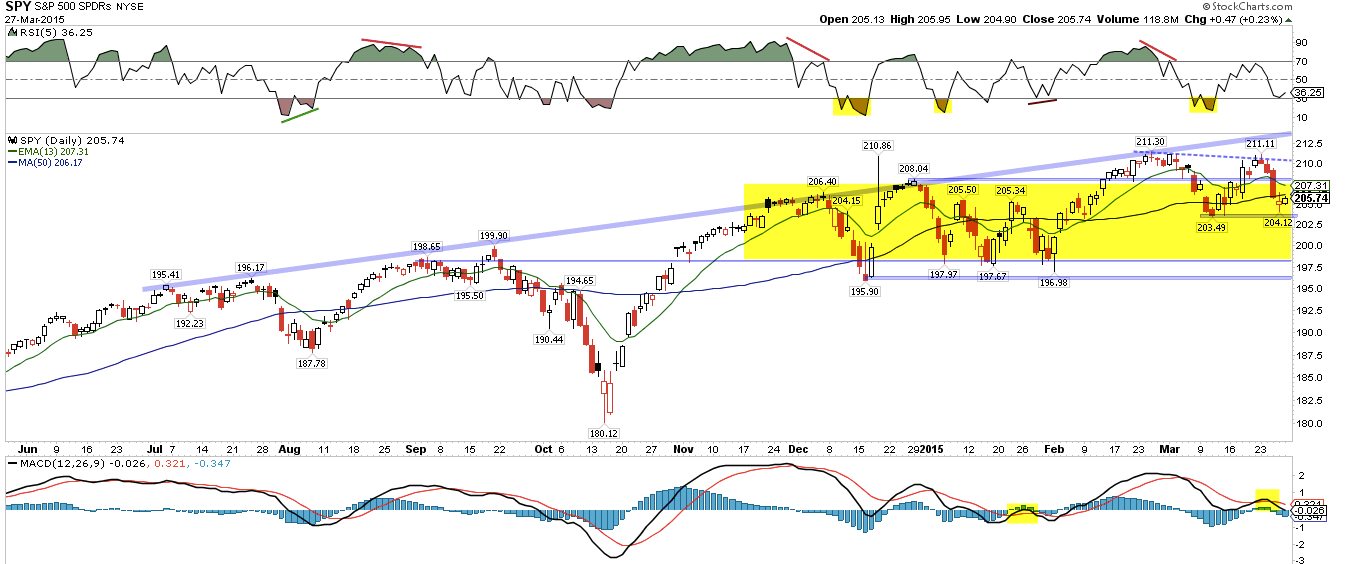
SPY looks like a failed breakout. It needed to hold 208 and it didn't, falling back into its prior trading range. Like NDX, it has a lower high and its RSI is not yet as oversold as it was at prior lows, nor is there a positive divergence. MACD is declining and the 13-ema is falling. Much below 204 and it could easily drop to 198, the bottom of the yellow shaded range.
Weakness early this week, in which drops SPDR S&P 500 (ARCA:SPY) to prior lows near 203.6, may be worth a trade; weekly S1 is just below at 203 for a stop. A drop to this level would also create a positive divergence in the hourly RSI. Upside would be a backtest of 208. If the pivot holds by mid-week, upside shifts to weekly R1 near 210.
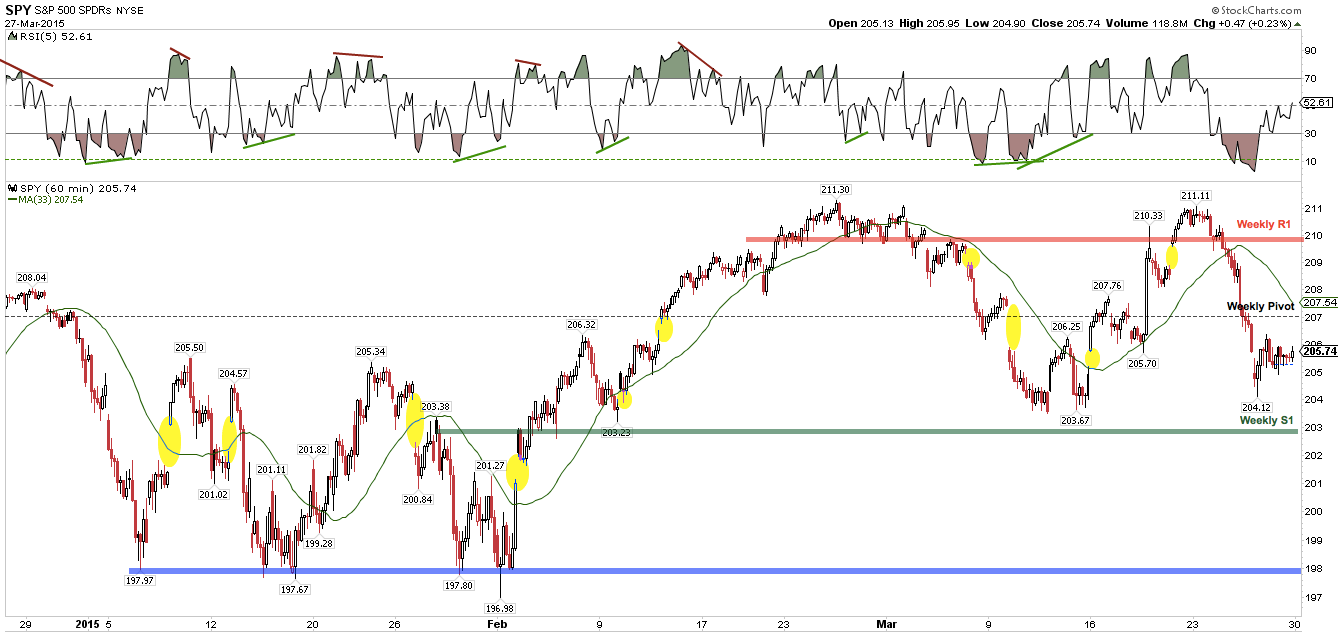
While there might be a trade long with a tight stop in US indices, it's hard to feel much confidence in a sustained rise.
For one, as mentioned above, the markets are largely trend-less. At the sector level, only health care and discretionary stocks are trending higher (arrows). Note the flat or declining blue 50-dma for most of the other sectors.
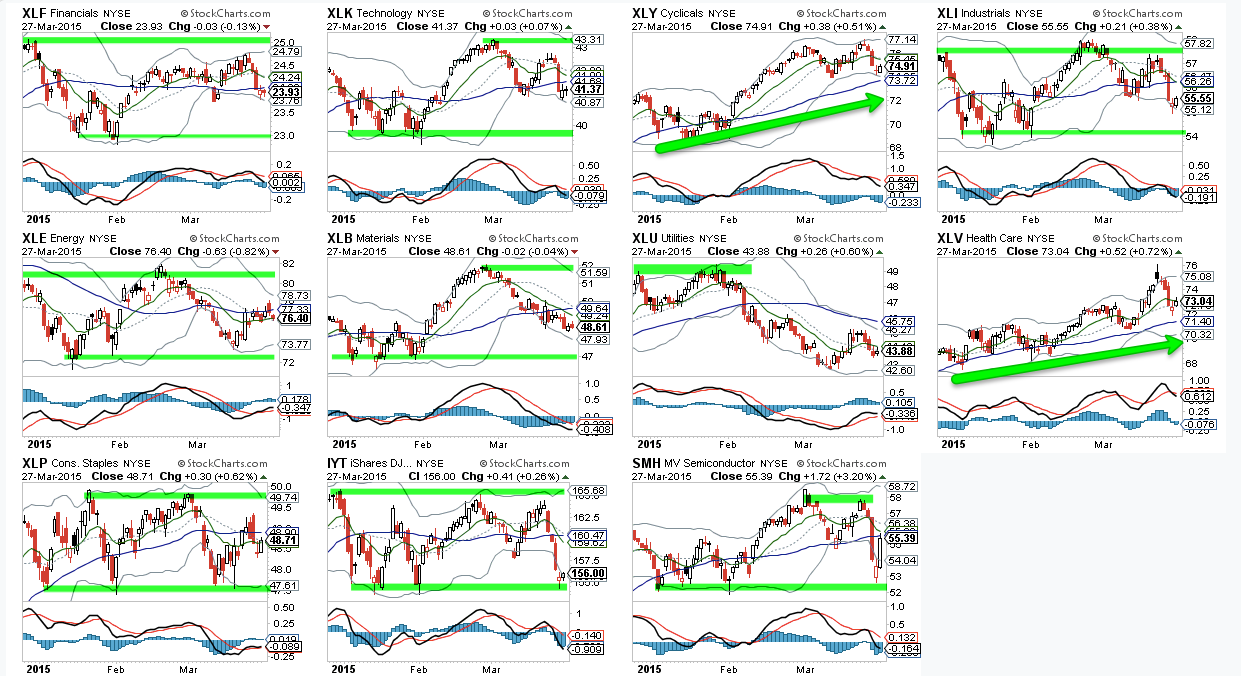
Moreover, in a trading range environment, you'd like to buy when indices are oversold, but as mentioned above, neither NDX nor SPY has yet reached prior oversold levels.
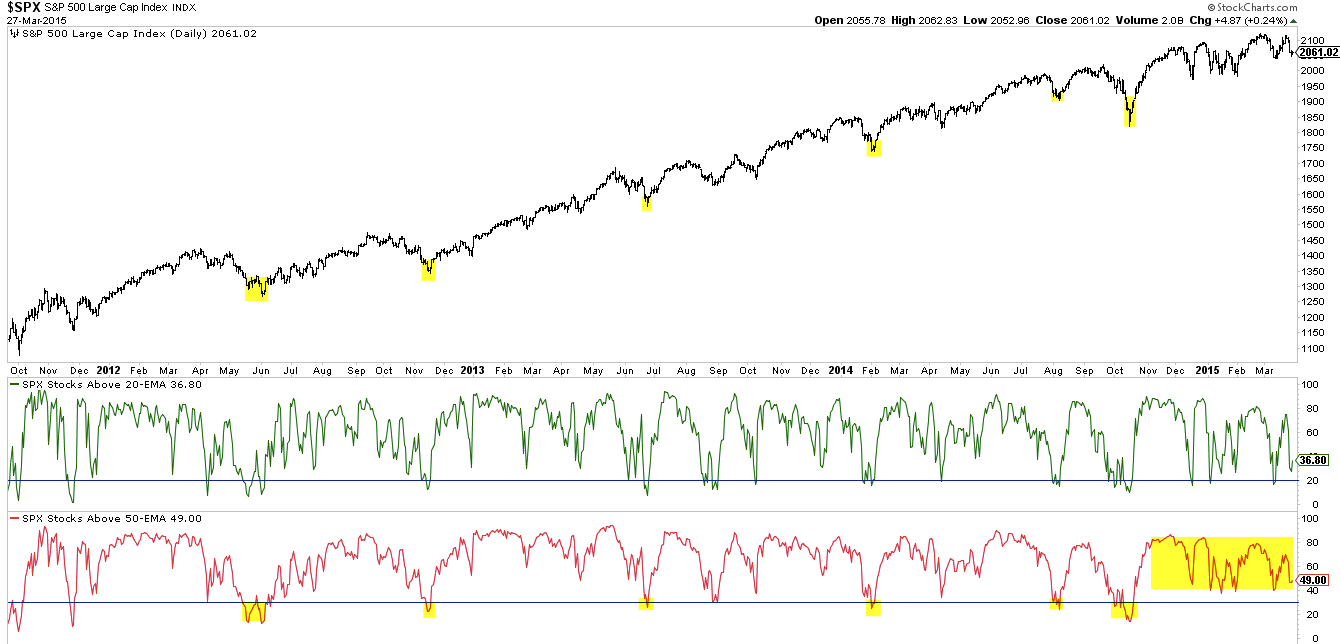
That is also true of breadth. SPX would become oversold when less that 20% of its components are under their 20-ema (middle panel) or, better still, less than 30% are under their 50-ema as at October's low (yellow shading in lower panel). That SPX keeps bouncing before it reaches these oversold levels has contributed to upside failures and quick reversals. To be clear, the same could again happen now, in which case the rally would probably again fail. A better set up would be for breadth to become more oversold than at present.
Similarly, three month new highs minus new lows has not yet reached the oversold levels that have marked reversal points in the past several months (chart from Brett Steenbarger).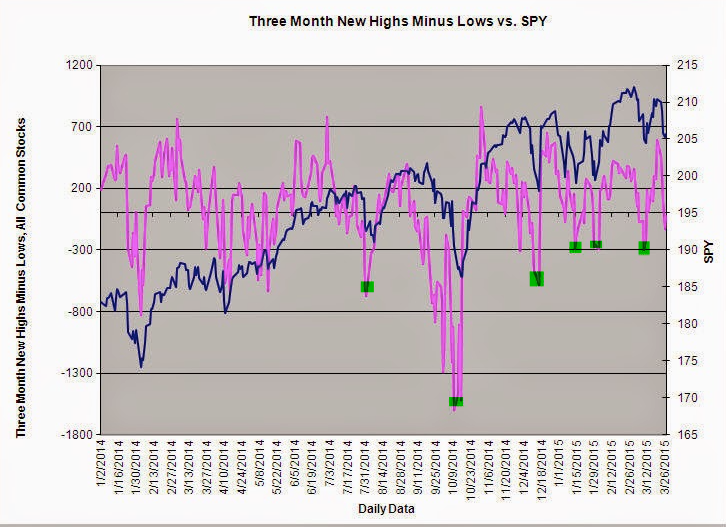
The same is true for sentiment. The pattern of quick reversals hasn't yet frustrated investors. The Investors Intelligence survey this week showed bulls outnumber bears by 4 times, which is an extreme. NAAIM investors are 84% long, which is bordering on extreme bullishness. Until this reaches a bearish extreme, rallies will likely continue to fail. More on this here.
SPX fell four days in a row this week before closing higher Friday. This pattern has happened 14 times since 2010 (marked in yellow); in 13 of 14, SPX continued higher another two days. So the odds favor further upside through Tuesday (data from Chad Gassaway; his post on this is here).
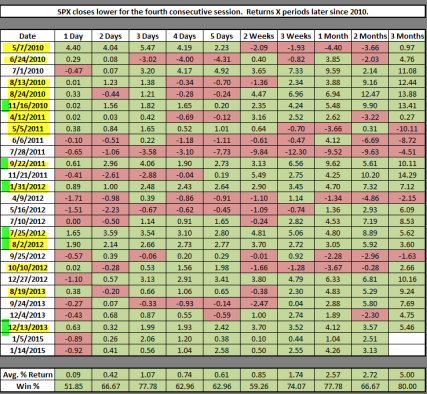
In only 6 of those 14 cases, SPX continued higher beyond the next 2 weeks (marked with a green square, above). So most of the time (57%), the rally was short lived.
It's actually worse than the statistics show. In two cases (November 2010 and December 2013), SPX made lower intraday lows (lower than the low on Day 4) within a week. And there was a significantly lower closing low 8 days after the 4 day loss in September 2011. So really the rally after a 4 day loss failed 79% of the time with the index at least revisiting the low on an intraday basis in the next week or so.
Two more cases are also suspect: late July and early August 2012. Why? Because SPX had just fallen 10% over a two month period into a low in June 2012. It was a breadth and sentiment washout which hasn't been equalled since. The set up for the continued rise in July and August was much different than today.
Net, while a rise early in the week is possible, its likely it will fail thereafter.
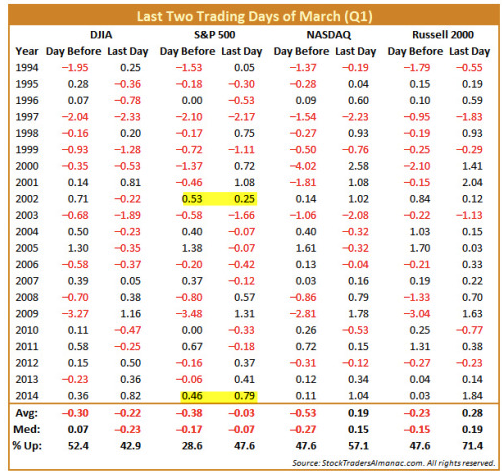
The last days of March (Monday and Tuesday) are historically weak.They have both been positive only twice in the past 20 years (data from Almanac Trader).
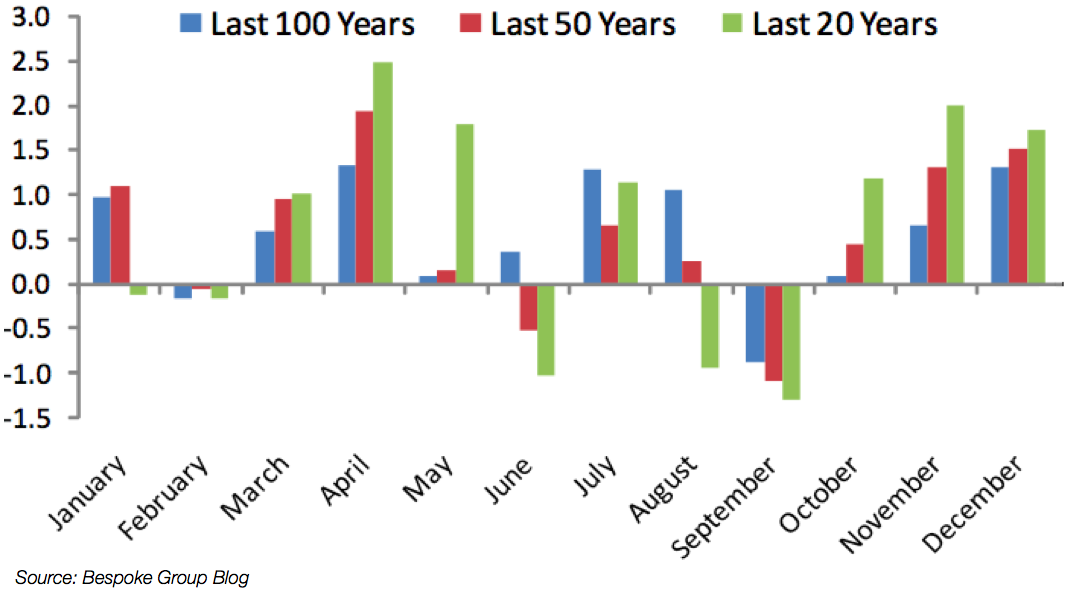
April starts on Wednesday; it is historically one of the strongest months of the year. It's returns have been terrific over a variety of timeframes (data from Bespoke).
But the first half of April has been weak the past four years in a row. Strength has come in the second half of the month. If this patterns holds again this year, upcoming weakness sets up an attractive rally into month end.
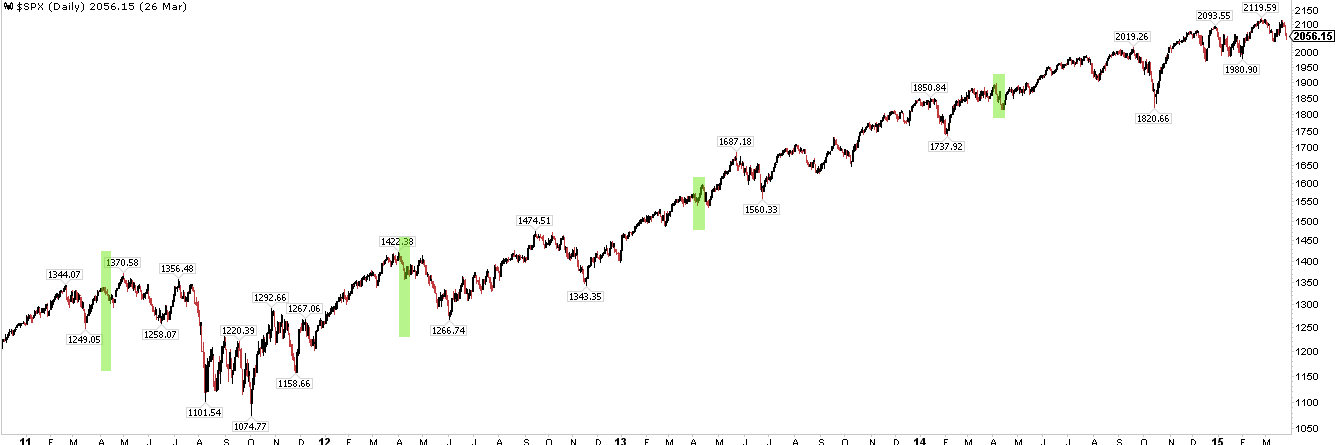
As an aside, April was strong from start to finish in 2010 but the set up was different than today as SPX had just fallen 10% into February of that year.
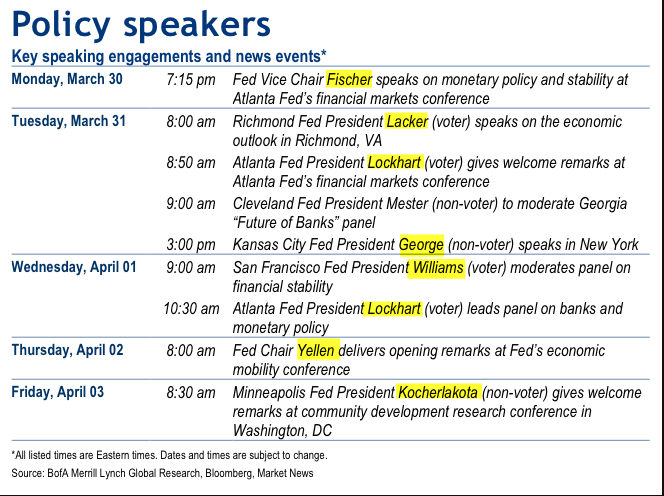
A final consideration is the upcoming week is holiday shortened. During the next four trading days, a number of Fed officials will be speaking. Expect strength in equities on dovish comments.
Non-farm payroll (NFP) data will be released on Friday when the market is closed.
Our weekly summary table follows.

