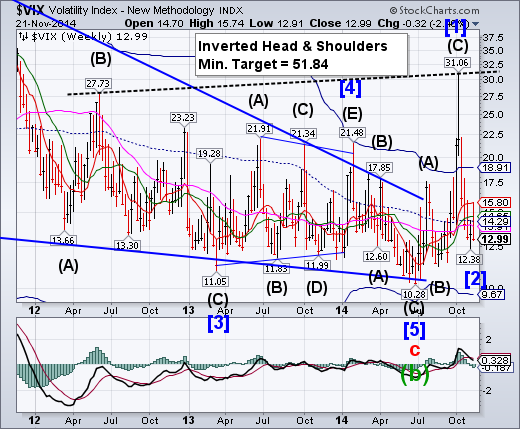
-- VIX challenged its highest resistance at 15.80 before closing beneath its mid-Cycle resistance at 14.29. This completes a reversal pattern at the start of a Primary Wave [3] which may meet or exceed the Head & Shoulders target listed on the chart.
SPX probed above its Broadening Top trendline.
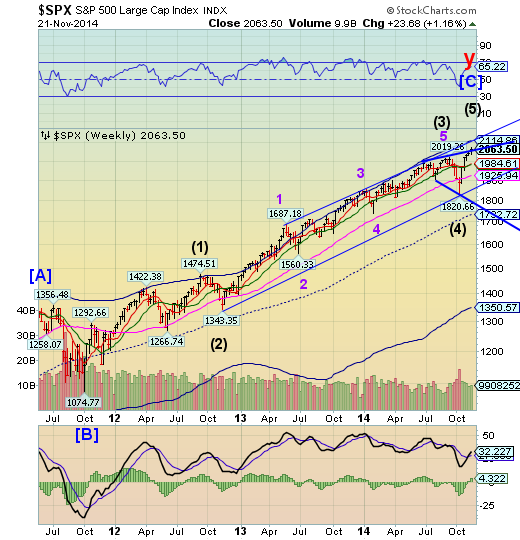
SPX probed above the upper trendline of its Orthodox Broadening Topat 2048.00 and closed above it this week.The megaphone is a reversal formation that carries a very bearish potential target. Unfortunately, most investors will be unaware of this probability.
(ZeroHedge) The explosive surge in US equity markets off the 'Bullard' lows have swung the Relative Strength Index (RSI) from its most oversold in 24 months to the most overbought in 33 months in a record amount of time. The last time the market was this 'overbought', the S&P 500 fell almost 11% in the following few weeks...
(ZeroHedge) For all the obfuscation surrounding the topic of stock buybacks and corporations returning record amounts of cash to their shareholders, the bottom line is as simple as it gets.
This is what you are taught in CFO 101 class:
if you see organic growth opportunities for your business, or if you want to maintain the asset quality generating your cash flows, you invest in (either maintenance or growth) capex.
if there are no such opportunities, you return cash to investors (or, maybe spend a little on M&A unless you are Valeant in which case you spend everything and then much more).
NDX reaches a new high.
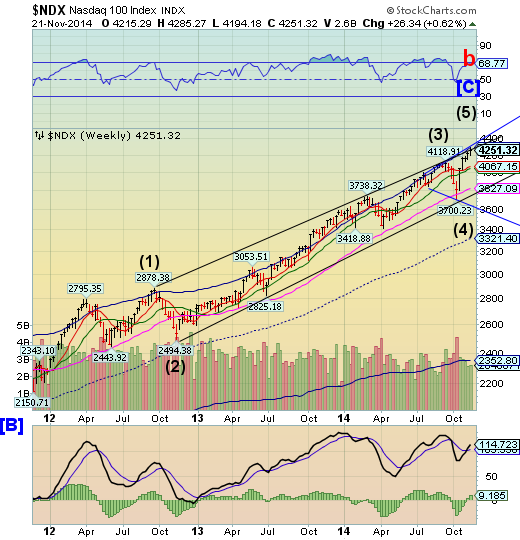
NDX attempted to reach Cycle top resistance at 4289.99, but fell short, closing at a new high this week.The Orthodox Broadening Top formations in the indexes are bearish reversal patterns that indicate high public participation, peak emotional involvement and no risk control.A decline beneath the October 15 low at 3700.23 completes the pattern and signals a major change in trend is underway. The excitement isn’t over yet.
(ZeroHedge) While some might scoff at the idea of there even being a bubble in hi-tech start-ups, it appears the massive wall of money that has been thrown at dot-com 2.0 names - all money-losing, social, mobile, cloud name-droppers - has dried up. As The TechCrunch Bubble Index shows, the last 90 days have seen startup-funding announcements collapse over 40% to their lowest level in almost 3 years...
High Yield has made a new high.
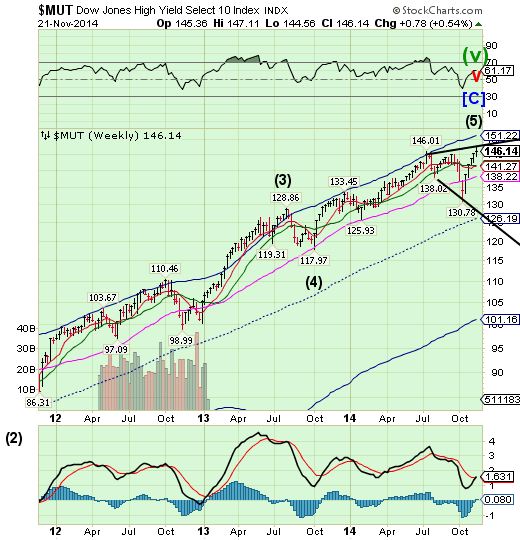
The High Yield Index made a new high, topping its July 3 high at 146.01.The next move is likely to be a decline to or beneath mid-Cycle support at 126.19.Now is time to pay attention to the Orthodox Broadening Top formation as well. A decline beneath weekly Long-term support at 138.22 and the lower trendline puts MUT in motion toward its first target.
(ZeroHedge) The growing divergence between equity and credit markets this year have seldom been far from our pages (especially how, over many cycles, credit has led and stocks followed at trend turns), and now it appears Barclays also recognizes this fact. As they note, in 2007, as hints of the financial crisis were unveiled, spreads in the high yield market increased sharply. Meanwhile, the equity market climbed to a new record high. Had equity investors heeded the warning being sent from high yield, significant losses may have been avoided... and currently high yield sell signals suggest equity investors should position defensively!
The Euro bounce is deflected.
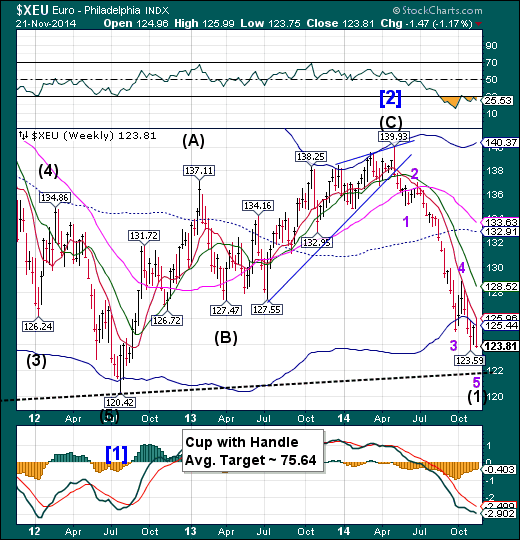
The Euro bounce was repelled at weekly Short-term resistance at 125.96.It now appears that it may challenge the Lip of a Cup with Handle formation at 122.00.The consolidation was a short one after failing to gain elevation above Model resistance. The decline appears capable of continuing until the first week of December
(Reuters) - The euro fell sharply on Friday after European Central Bank chief Mario Draghi said inflation expectations were declining to levels that were very low, keeping the door open for further monetary easing soon.
The euro fell 1.19 percent to $1.2389 EUR/USD and dropped 1.58 percent against the Japanese yen to 145.89 yen EURJPY=.
"His comments have hit the euro hard," said Niels Christensen, FX strategist at Nordea, adding that euro zone inflation data next week would be a crucial influence on the ECB's thinking.
Euro Stoxx lingers at “point 7.”
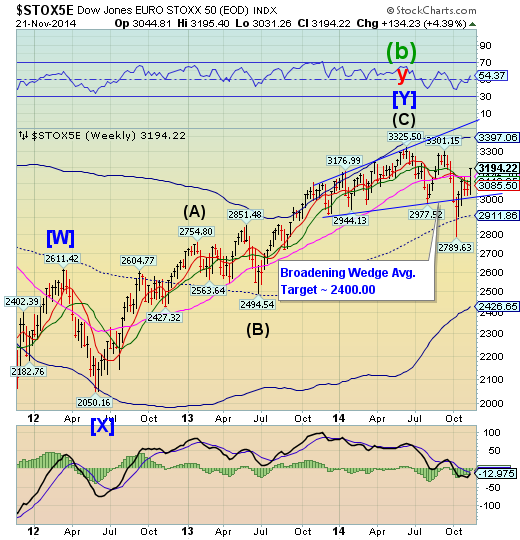
The EuroStoxx 50 Index reversed at “point 7” resistance of its Broadening Wedge formation, but continues to find support at its lower trendline. A cross beneath the lower trendline at 3000.00 has the potential to propel Stoxx to its Cycle Bottom trendline at 2415.48. Short-term resistance at 3112.82 continues to turn back attempts to go higher.
(MarketWatch)—European stocks slipped Friday as investors assessed a round of economic growth data from the eurozone, but the benchmark STOXX Europe 600 (XETRA:SDJ600) managed to eke out a minor gain for the week.
Gross domestic product figures from the eurozone confirmed sluggish activity for the 18-member region in the third quarter, growing by 0.2% quarter-on-quarter, according to the European Union’s statistics office. The figure was slightly better than expected.
Germany registered growth of 0.1% in the third quarter, allowing the largest economy in the eurozone to dodge recession, while French GDP expanded 0.3%, coming after a slight contraction in the second quarter. But Italy’s GDP contracted 0.1% in the third quarter. On more upbeat notes, Spain’s GDP grew 0.5% and Greece posted growth of 0.7%, marking an end to its recession.
The Yen extends its decline to the lower bearish target.
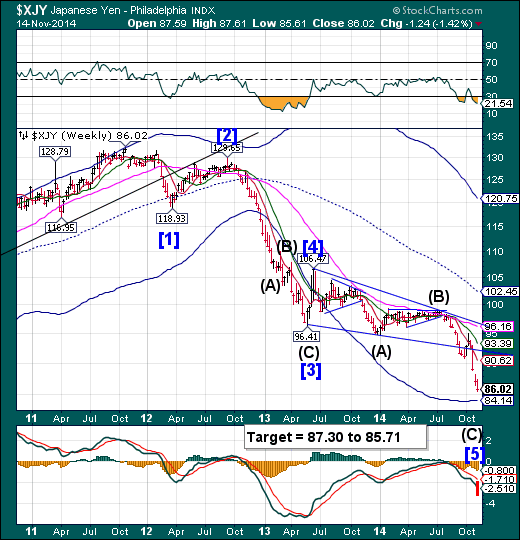
The Yen has declined to the lower range of its bearish target (shown in the chart). The Cycles Model called for a low last Friday but targets include price as well as time. This decline has been quite persistent.
(WSJ) Japanese Prime Minister Shinzo Abe has kept tight-lipped about the yen’s further slide in recent weeks, leading many to wonder if he was happy with the move. But a close economic adviser to Mr. Abe suggested that the yen now isn’t so far from levels the government might consider too weak.
“If it goes to 120 yen [to the U.S. dollar], that will make me think,” Etsuro Honda, one of the architects of Abenomics, said in an interview with The Wall Street Journal.
“Well, maybe levels around 120 are acceptable, but if it weakens as much as to 125, that would make me a bit nervous, make me stop and think, ‘Is this okay?’” he said.
The Nikkei challenges the Broadening Top.
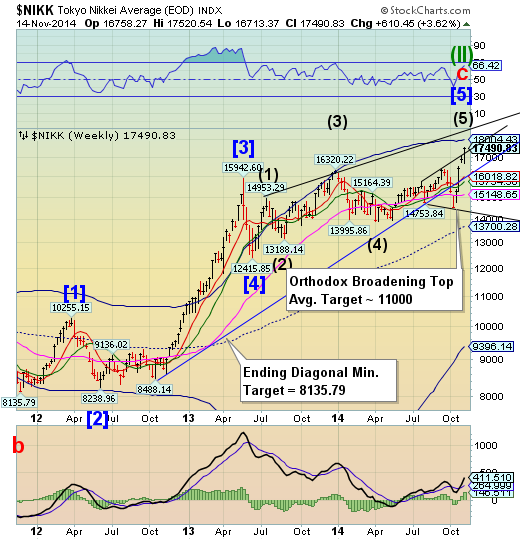
The Nikkei challenged the upper trendline of its Orthodox Broadening Top formation in what may be a final exhaustion surge.This is considered the peak of the formation and a decline to mid-Cycle support at 13700.28 may be the next move. The Broadening formations represent a market that is out of control and has a highly emotional public participation. Of course, the bank of Japan is doing more than just cheerleading.
(Reuters) - Investors worldwide pulled $3.8 billion out of Japanese stock funds in the week ended on Wednesday, marking their biggest outflows since May 2010, data from a Bank of America Merrill Lynch Global Research report showed on Friday.
Stock funds overall attracted $7 billion, marking the third straight week of inflows. Exchange-traded funds investing in stocks got all of the new cash, with inflows of $12 billion, while $5 billion flowed out of equities mutual funds, according to the report, which also cited data from fund-tracker EPFR Global.
US Dollar may go higher.
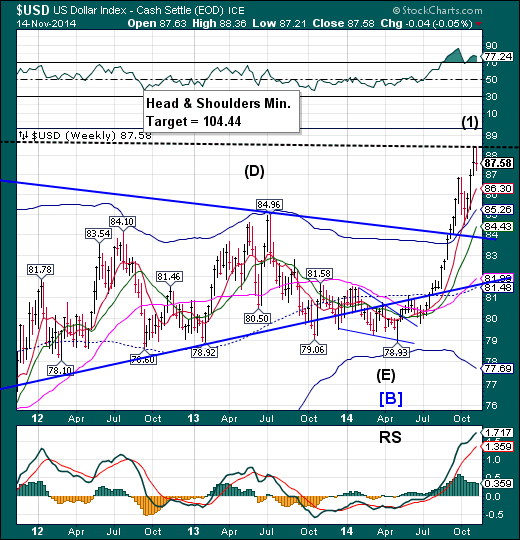
The US Dollar challenged last week’s high at 88.32 by a nominal .04, but with that challenge suggests that it may extend its rally even further.We may now see the dollar continue to rally through the end of November, even as it digests some of the gains it has recently made.
(OfTwoMinds) I have been suggesting for several years that the U.S. Dollar would confound those anticipating its demise by starting a long secular uptrend.In early September I made the case for a rising U.S. dollar, based on the basic supply and demand for dollars stemming from four dynamics:
Demand for dollars as reserves
Other nations devaluing their own currencies to increase exports
“Flight to safety” from periphery currencies to the reserve currencies
Reduced issuance of dollars due to declining U.S. fiscal deficits and the end of QE (quantitative easing)
Since then the dollar has continued its advance, and is now breaking out of a downtrend stretching back to 2005—and by some accounts, to 1985:
USB remains in an exhaustion formation.
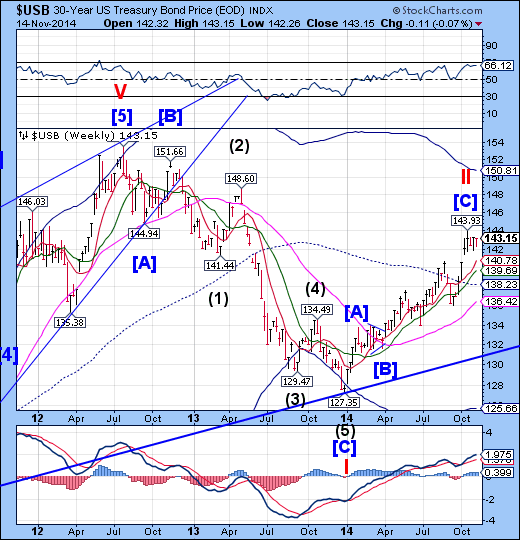
The Long Bond cannot seem to leave its exhaustion formation that it made five weeks ago. While it has failed to go higher, the reversal is becoming overdue. This weekend offers a probable reversal date that may take USB to mid-December.The potential target may be weekly Cycle Bottom support at 125.66.
(ZeroHedge) If yesterday's slightly tailing 10-Year auction was a non-event, today's $16 billion 30 Year refunding was one of the uglier long-end auctions in a while, which perhaps is to be expected in a world in which the Fed is, for the time being, no longer monetizing Treasurys and Dealers no longer have the option to turn around and flip the paper back to the Fed on a whim, and with guaranteed profit.
The highlights: printing at a high yield of 3.092%, this was a notable 1.7 bps tail to the 3.075 When Issued, and certainly wider than last month's 3.074% yield. Keep in mind yesterday's 10 Year priced inside of the October 10Y auction
Gold may be retesting resistance.
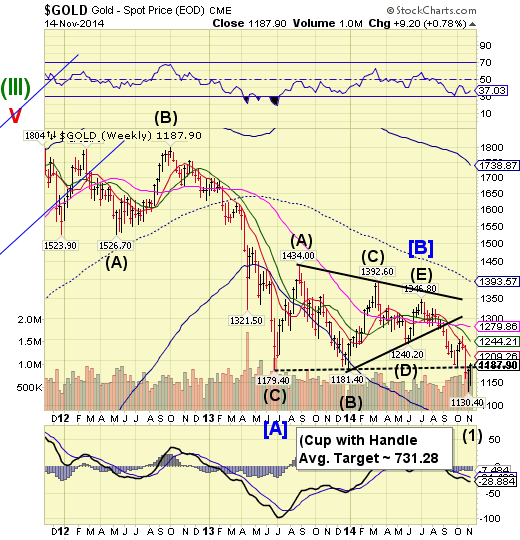
Gold reached its first Cycle low beneath the Lip of its Cup with Handle formation.It is now challenging that long-term support. The rally may last another week as the Cycles Model suggests the decline may soon resume into early December.
(ZeroHedge) Just as China is buying 'cheap' oil with both hands and feet, so Russia, according to the latest data from The World Gold Council (WGC) has been buying gold in huge size. Dwarfing the rest of the world's buying in Q3, Russia added a stunning 55 tonnes to its reserves, as The Telegraph reports, Putin is taking advantage of lower gold prices to pack the vaults of Russia's central bank with bullion as it prepares for the possibility of a long, drawn-out economic war with the West.
Russia bought more gold in Q3 then all other countries combined...
The decline in Crude may be temporarily over.
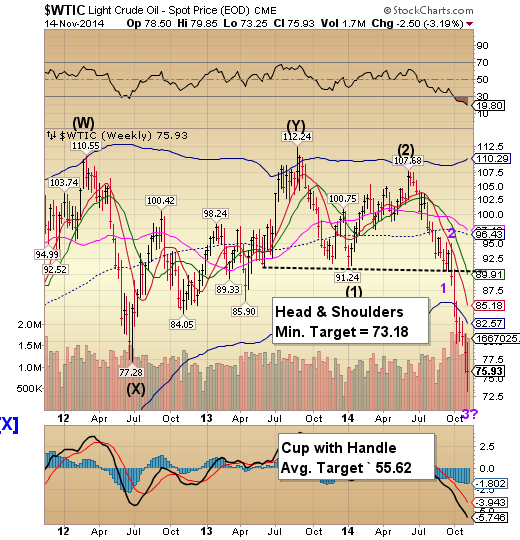
Crude came within 7 ticks of its Head & Shoulders target today, which may qualify it for a Trading cycle and Master cycle low. Should this be the Cyclical low we are looking for, there may be a few weeks of consolidation before it resumes a further decline.
(USAToday) Backers of the Keystone XL pipeline became emboldened recently by the prospect of a Republican-led Congress finally pushing the project through.
But can dropping crude prices punch a hole in the controversial project?
The cost of benchmark West Texas Intermediate oil dropped to $74.42 a barrel on Thursday — a 25% drop from the triple-digit highs it reached this summer. Federal analysts have warned that producers in the Canadian oil sands — slated to be a top consumer of the pipeline — will need oil prices to stay between $65 and $75 a barrel to make production there economically feasible.
China closed above the Broadening Top trendline.
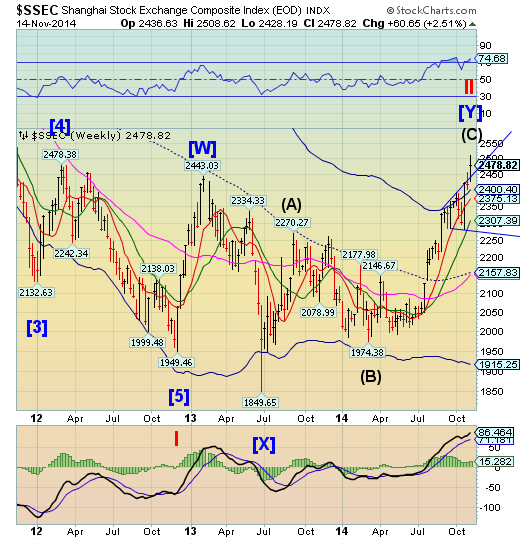
The Shanghai Composite continued beyond the trendline in point 5 of an Orthodox Broadening Top. This weekend’s Trading Cycle Pivot may turn SSEC down to Point 6 which may go as far as its mid-cycle support at 2157.83 over the next two weeks or so.Soon after, the formation calls for a full retracement to the Cycle Bottom at 1918.58.
(ZeroHedge) Having told the world that it will not be undertaking system-wide rate cuts or stimulus - focusing more on idiosyncratic safety nets - last night's data from China is likely to have the PBOC frowning. Fixed Asset Investment (lowest growth since Dec 2001) and Retail Sales (lowest growth since Feb 2006) missed expectations, but it was the re-slump in Industrial Production (after a small 'huge-credit-injection-driven' bounce in September) that is most worrisome asChina's 2014 output is growing at its slowest since at least 2005. As Michael Pettis previously noted "China will be no different... growth miracles have always been the relatively easy part; it is the subsequent adjustment that has been the tough part."
The Banking Index may have reversed this week.
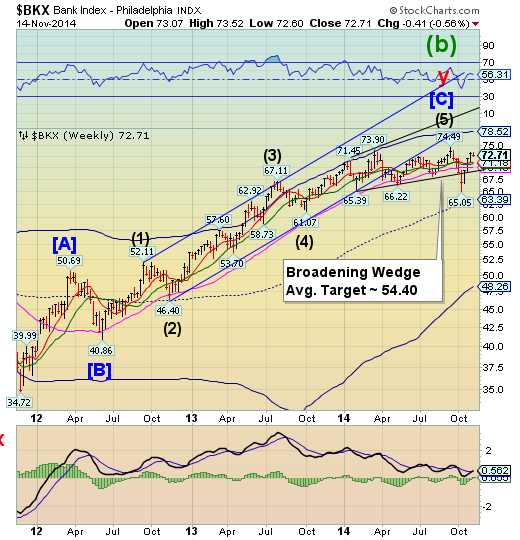
--BKX didn’t do as well this week as some of its sister indexes.This week’s reversal may be the beginning of a third wave, which may be quite destructive. The next target (point 8) may be 20% beneath the lower trendline once it declines beneath its Short-term support at 71.18.
(ZeroHedge) While we have noted previously that "a cluster of central banking investors has become major players on world equity markets," and the BoJ has recently tripled its direct manipulative buying of stocks (after buying a record amount in August)... the conspiracy-theorist-dismissers will have to close their eyes and ears as the Swiss National Bank admits in its 2013 annual report that it greatly expanded its share of foreign stocks purchased... most notably small-cap companies.
Maybe it is time to reign in the SNB with the Gold Initiative?
(ZeroHedge) Early in 2014, when the FX rigging scandal was still news, one of the most disturbing developments to emerge was that none other than the venerable Bank of England itself had been engaged in collusion with various manipulating parties, explicitly those participating in "The Bandits Club", "Cartel" and other chatrooms, as described in "Bank Of England Encouraged Currency Manipulation By Banks." As Bloomberg reported at the time:
Bank of England officials told currency traders it wasn’t improper to share impending customer orders with counterparts at other firms, a practice at the heart of a widening probe into alleged market manipulation, according to a person who has seen notes turned over to regulators.
(ZeroHedge) Spot the banana republic:
Nation #1 spends and issues tens of trillions in taxpayer funds and debt, crushing the growth potential of future generations, just to bail out a banking sector full to the brim with criminal "riggers" (as today's settlements once again prove), where bubble mania was so pervasive not a single bank would have survived absent a global central bank bailout, and where bank executives wouldn't bend over for anything less than a million.
Nation #2 just sentenced two senior officials of a bank that collapsed under (a measly by New Normal standards) $1 billion in debt to 15 years in prison each for embezzlement and fraud.
Nation #1 is, of course, the US (or any other western nation). Nation #2 is Afghanistan.
