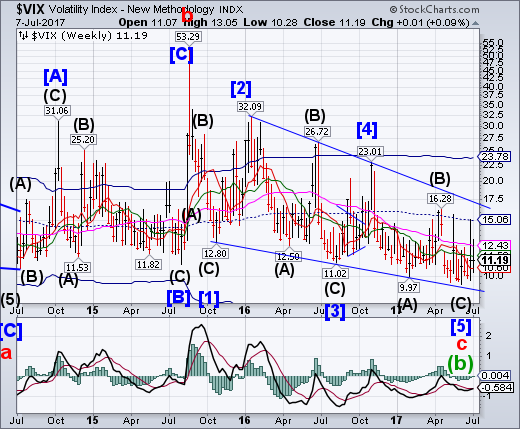
VIX had an inside week, after challenging mid-Cycle resistance a third time in three months. It closed above Short-term support at 10.60 and is on an aggressive buy signal. Once above the upper trendline of the Ending Diagonal formation, it has the distinct probability of reaching the August 2015 high at 53.29. In other words, a complete retracement is possible.
It shouldn't be too surprising that the XIV exchange-traded note, which is designed to deliver the inverse performance of the well-known CBOE Volatility Index (or the VIX) on a daily basis, is attracting fresh attention after surging as much as 87 percent this year. But some caution that investing in the exchange-traded product now could be deeply risky.
SPX tests Short-term support.
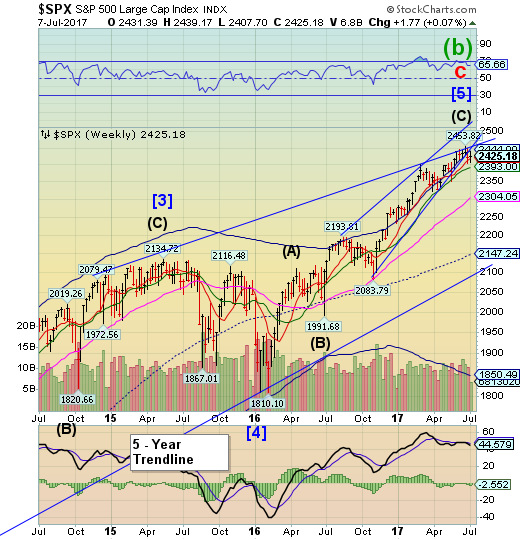
SPX challenged the Weekly Short-term support at 2417.86, closing just above it for a flat week. This may be the start of a decline that completely retraces the rally from the February 2016 low. This also puts the SPX in danger of violating the 5-year trendline at 2100.00.
U.S. stocks closed higher on Friday on the back of stronger-than-expected employment data.
The Dow Jones industrial average rose 94.30 points to close at 21,414.34, with McDonald's (NYSE:MCD) contributing the most gains. The 30-stock index briefly traded more than 100 points higher. The S&P 500 rose 0.6 percent to 2,42518, with information technology leading advancers. The NASDAQ composite outperformed, advancing 1.04 percent to 6,153.08.
The U.S. economy added 222,000 jobs in June, the Labor Department said. Economists polled by Reuters expected an increase of 179,000. The unemployment rate ticked higher to 4.4 percent from 4.3 percent. Wage growth, which is viewed as a measure of inflation, rose by just 0.2 percent, however.
NDX challenges Intermediate-term support.
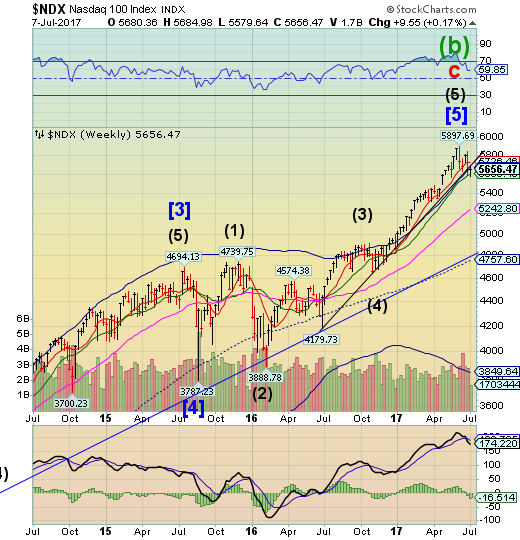
NDX challenged Intermediate-term support at 5599.45, but closed above it. NDX is on a confirmed sell signal. There is expected to be about two weeks of decline ahead. It’s time to take necessary precautions against a significant breakdown.
Over the years, I have regularly addressed the psychological and emotional pitfalls which ultimately lead individual investors to poor outcomes. The internet is regularly littered with a stream of articles promoting the ideas of “dollar cost averaging,” “buy and hold” investing, and “passive indexing” as the solution to achieving your financial dreams.
However, as I addressed in the “Illusion Of Declining Debt To Income,” if this was truly the case, then why is the majority of Americans so financially poor?
But here are some stats from a recent Motley Fool survey:
“Imagine how the 50th percentile of those ages 35-44 has a household net worth of just $35,000 and that figure includes everything they own, any equity in their homes, and their retirement savings to boot.
That’s sad considering those ages 35 and older have had probably been out in the workforce for at least ten years at this point.
High Yield Bond Index declines beneath support.
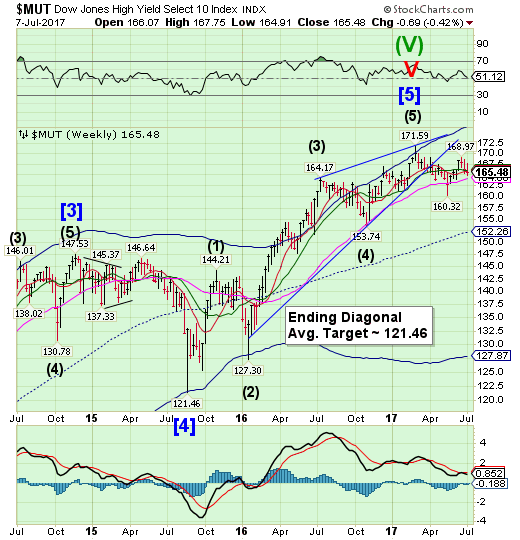
The High Yield Bond Index declined beneath Intermediate-term support at 165.91, closing beneath it. The sell signal has been reinstated beneath that support level. The Cycles Model suggests weakness may continue on a timetable similar to that of equities.
Conventional Wall Street wisdom says higher interest rates eventually hurt stocks. But in the current environment, it will be a dramatic change in equities that hits rates, say some analysts.
Skittishness among stock investors of late, those who have been rotating out of high-flying technology shares, prompted pundits on Wall Street to declare that central bank hawkishness is behind such angst.
Bank of America Merrill Lynch (NYSE:BAC) economists in a note from Friday said that higher rates over the next six months will be negative for stocks and high-yield bonds. Very simply, when bonds lose favor their prices fall, sending their yields, essentially a term for market-set interest rates, higher. That raises borrowing costs for the companies that make up the stock market.
USB falls beneath Intermediate-term support.
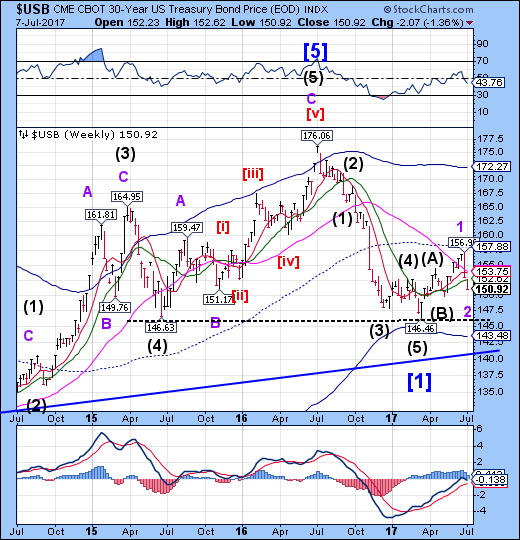
The Long Bond extended its pullback beneath Intermediate-term support at 152.62. This may be a suckers’ play, as the Cyclical trend is up. The rally has quite a distance to go, since it must complete the right shoulder near 165.00 before plunging through the neckline near 146.50.
The Federal Reserve saw possible risks in the U.S. bond market that include a jump in long-term Treasury yields and money market funds selling out of government and agency debt, according to a central bank report released on Friday.
These possible threats to the bond market seem remote though as the Fed assessed that vulnerabilities in the financial system "remain moderate on balance" in its semiannual report on Congress.
The euro may be edging toward its Cycle Top.
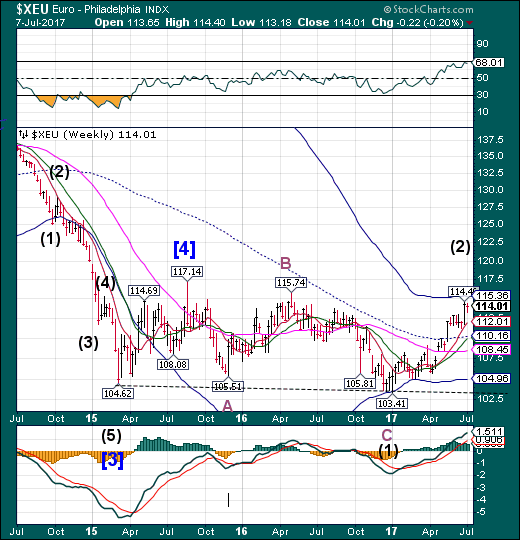
The euro pulled back from Cycle Top resistance this week. The Cycles Model allows for up to two weeks of strength before a major reversal. Be on the alert for a challenge of the Cycle Top. Afterwards, a decline beneath Short-term support at 112.01 may be a sell signal.
The euro has had an impressive rally since mid-April, including a surge last week that took it to its highest level against the dollar since May 2016. The logical question now is whether the run is over, especially after the currency’s softness this week in the face of some strong euro-zone economic data. Based on market fundamentals that have led analysts to rethink their pessimistic views and technicals that convey corporate hedging strategies, the euro is likely to strengthen further.
Fundamentals have been supportive for the euro since the beginning of 2017, when many analysts were calling for the currency to weaken to parity with the dollar. Currently, the euro-area inflation rate is 1.3 percent, but it was around 2 percent for a few months earlier this year. And growth in the euro zone looks strong, with the Ifo index, a leading indicator of overall German GDP, rising to an all-time high in June. Plus, the euro-zone manufacturing purchasing managers index, which is a critical leading indicator of growth, rose in June to the highest level since April 2011. The June reading also showed a 48th monthly consecutive expansion.
Euro Stoxx forms a Head &Shoulders pattern.
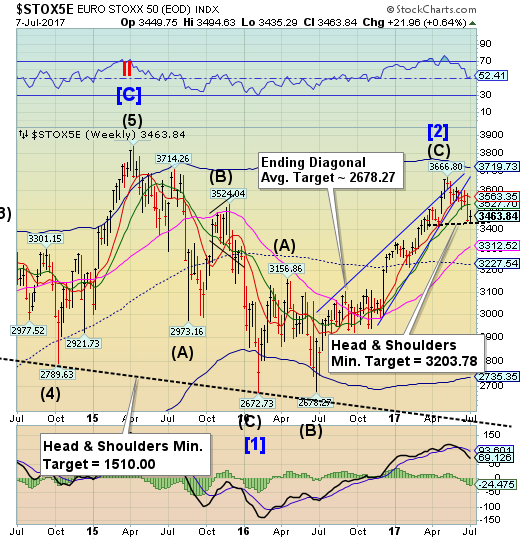
The Euro Stoxx 50 Indexis giving evidence of a continued decline in the near term. This decline has confirmed the sell signal for the EuroStoxx and the new Head &Shoulders neckline may define the next downside target. The Cycles Model calls for up to two more weeks of decline.
European stocks closed little changed on Friday as investors digested fresh economic data, eyed a G-20 meeting in Hamburg and continued to mull the possible end of monetary stimulus from central banks.
The pan-European Stoxx 600 was 0.07 percent lower with most sectors in negative territory. For the week, the Stoxx 600 and the major bourses were little changed.
Media stocks were the worst-performing sector after several rating downgrades. BNP Paribas (PA:BNPP) downgraded WPP (LON:WPP) to "underperform" from "outperform", sending the stock more than 2 percent lower. It also downgraded Italy's Mediaset, which fell more than 3 percent on Friday. The latter said recently there was a chance it would sell its pay-TV unit's final season of Champion League matches for 2017-18 to Sky.
The yen extends its decline.
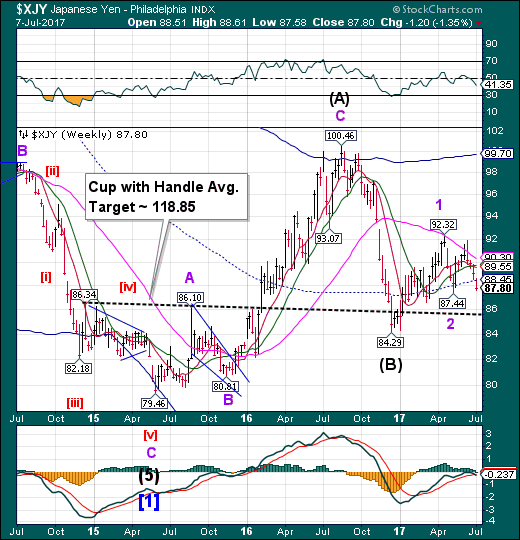
The yen declined beneath mid-Cycle support at 88.45, closing beneath it and creating a potential Master Cycle low. This extension of the decline sets up a false outlook for investors as they react to shorter-term moves and don’t recognize the longer-term trend. A breakout above mid-Cycle resistancemay reinstate a full-blown buy signal for the yen.
During this morning's bond rout when a poor French auction sparked a high-volume selloff in German Bunds which also hit Japanese JGBs before slamming US TSYs, Goldman said that:
With 10Y JGBs closing at 0.095 and getting hit at 10bp intraday, focus will be on how the BOJ will react tomorrow [i.e. now]. Opinions seem pretty split with some expecting an increase in purchase size in the 5-10 bucket, while others feel that the BOJ will let the 10Y run loose given the current sell off is more fundamental than event driven. With BOJ behind buying pace for 80tn reference anyway, personally I feel it doesn't hurt the BOJ to remind market of their presence.
Goldman was right: the BOJ, panicking after the overnight bond rout, not only reminded markets of its presence, but did so in dramatic fashion when it first boosted the amount of JGBs bought in the 5-10 year bucket from JPY 450BN to JPY 500 BN, and then for good measure unleashed the QQEWYC bazooka, announcing it would purchase an unlimited amount of 10Y JGBs at 0.11%, just a fraction above the BOJ's 0.10% line in the sand, only the second time it has done so in 2017 since February.
The Nikkei eases from its high.
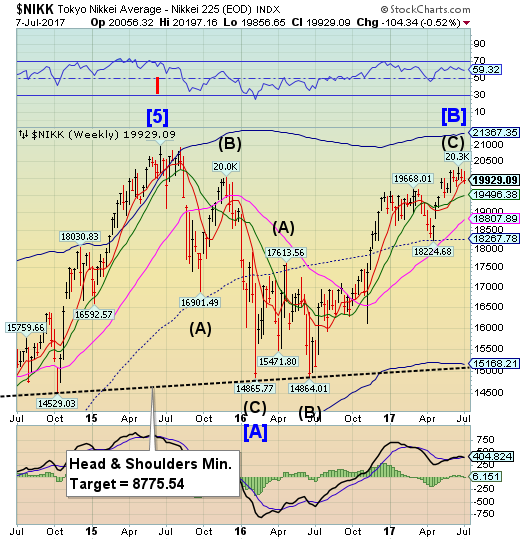
The Nikkei challenged Short-term support at 19932.28, closing just beneath it. Should the decline continue, the Nikkei may be on a sell signal.Further confirmation of the decline lies at Intermediate-term support at 19496.38.
With The Fed is full 'taper' mode and The ECB hinting, the world is left to rely on Kuroda to single-handedly buy-the-dip in stocks and maintain bond yields at the mandated level. With Japanese stocks fading in the last two weeks (as bond yields spike), it appears the ubiquitous 'hand of god' has disappeared.
And judging by the biggest Japanese equity fund outflows in 8 years, the fear is spreading.
US dollar creates a probable Head & Shoulder fromation
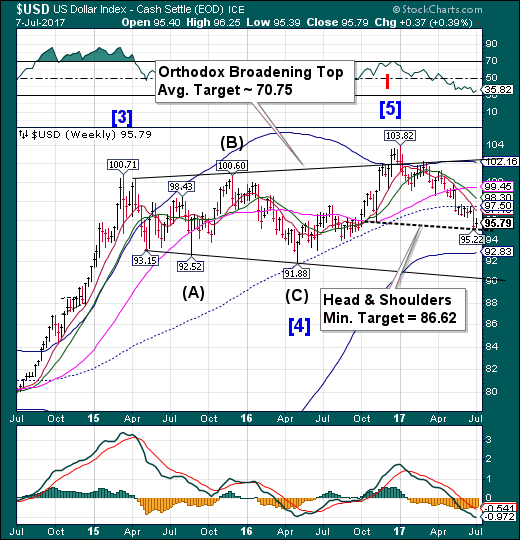
USD bounced from last week’s low, leaving a probable Head & Shoulders formation. The Cycles Model now allows for a continued decline for another two weeks. The near-term Orthodox Broadening Top target (not shown) appears to be near 85.50, which appears to agree with the new pattern.
The dollar gained on Friday after a report showed the U.S. economy created far more jobs than expected in June and previous months, keeping the Federal Reserve on track to raise interest rates at least one more time this year.
Following the report, the dollar rose to two-month highs against the yen, in its largest weekly percentage gain since late April. The greenback also climbed to a more than one-week peak against sterling.
Friday's data showed U.S. non-farm payrolls rose 222,000 last month, beating economists' expectations of a 179,000 gain. Data for April and May was revised to show 47,000 more jobs created than previously reported.
Gold declines beneath mid-Cycle support.
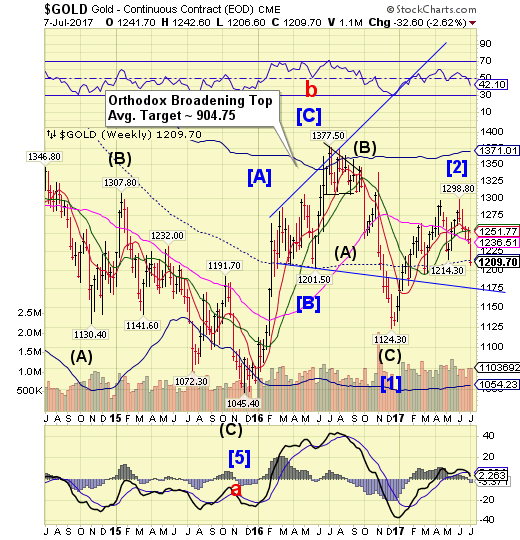
Gold declined through Long-term support at 1236.51 and through mid-cycle support at 1212.62. The Cycles Model suggests that a possible bouncemay not occur until the week of July 17. This implies a probable week or more of decline. Gold may go into freefall beneath the Broadening Top trendline at 1175.00.
Gold prices tumbled to their lowest level in nearly five months Friday on the back of stronger-than-expected employment data.
Futures for August delivery dropped 1.1 percent to settle at $1,209.70 per ounce, reaching levels not seen since March 15. The precious metal also posted its fifth-straight weekly loss, its longest losing streak since December.
The U.S. economy added 222,000 jobs in June, the Labor Department said. Economists polled by Reuters expected an increase of 179,000.
Crude rally stopped at mid-cycle resistance.
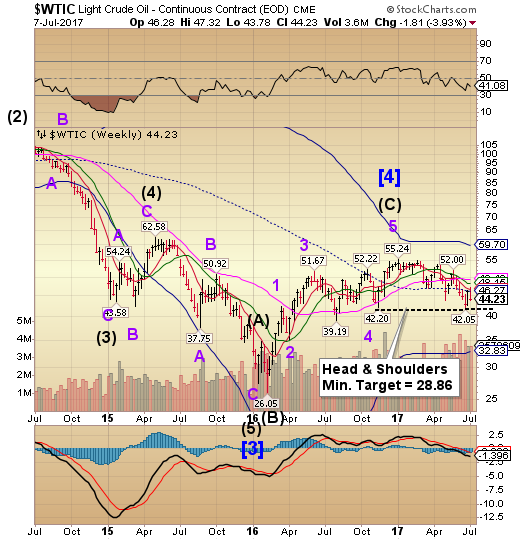
The Crude rally challenged mid-Cycle resistance at 46.22, but could not rise above it. The decline may have resumed and is due to challenge the neckline of the new Head & Shoulders formation at 42.00. A decline beneath the Head & Shoulders neckline is bearish and must be treated with respect.
Oil prices settled nearly 3 percent lower on Friday as rising U.S. production as OPEC exports hit a 2017 high cast doubt over efforts by producers to curb global oversupply.
Brent crude LCOc1 settled down $1.40, or 2.9 percent, at $46.71 a barrel, after falling to $46.28, its lowest in more than a week.
Both benchmarks posted a sixth weekly decline in the past seven weeks with WTI down 3.9 percent on the week and Brent off 2.5 percent.
Shanghai Index rises above Intermediate-term resistance.
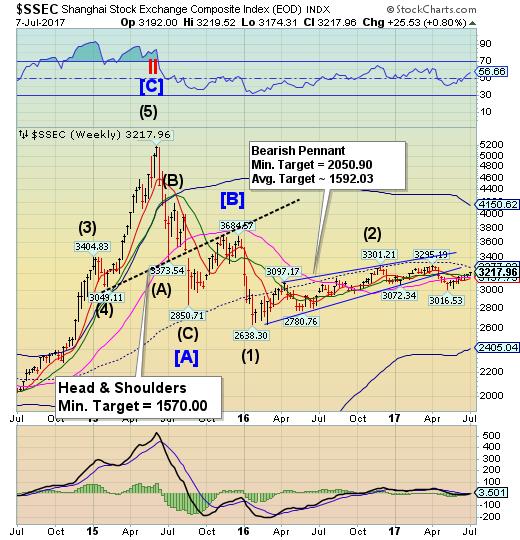
The Shanghai Index retested Intermediate-term resistance at 3174.26, closing above it. The index has extended its Cyclical period of strength with today or Monday being the last of it. It is now due for a probable two weeks of weakness. The potential for a sharp sell-off is rising.
Tepid wage growth has been frustrating Americans for years. But if trends in China’s manufacturing sector have any bearing on the US, there’s an upside to stagnant pay: Workers get to keep their jobs for now, at least.
In China, where real wages have doubled in the past decade, the opposite is true: Manufacturers, squeezed by rising labor costs and a paucity of skilled workers, are fueling an unprecedented boon in the adoption of automated technologies to cut down on the number of workers needed on factory floors, according to the latest findings of the China Employer-Employee Survey.
The Banking Index completes its correction.
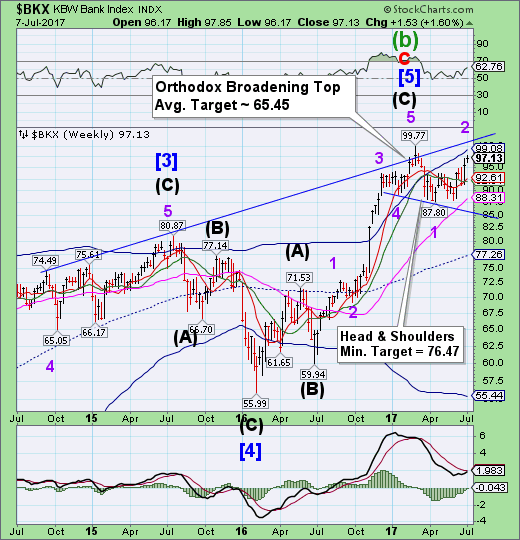
BKX ticked higher this week, rallying to a new retracement high. The shorts were being squeezed mercilessly. Weakness may develop as BKX declines beneath its Intermediate-term support at 92.01again.
Investors couldn’t sell Chinese banking giants fast enough this week.
Industrial and Commercial Bank of China Ltd., Agricultural Bank of China Ltd. and Bank of China Ltd. posted their worst weeks since at least June 2016, while China Construction Bank Corp. fell for a fifth consecutive week. The lenders were among the biggest decliners on a gauge of Chinese shares traded in Hong Kong, losing a combined $15 billion in value.
The losses are a turnaround for the Big Four lenders, which rallied along with the Hong Kong market earlier this year as concerns over bad debt gave way to optimism over improving economic growth and corporate profits. While analysts say little has changed for the Chinese banks, they are also especially vulnerable to a correction after going ex-dividend recently.
Any of the major risks U.S. banks face lay beyond their control, according to a review released by banking's top federal regulator on Friday that found the sector's financial performance remains strong.
The U.S. Office of the Comptroller of the Currency found that risks to banks lurk in competition from nonfinancial lenders and in the rapid evolution of money laundering and terrorism financing methods.
The OCC pointed to heavy reliance on third-party servicers and vendors as a place where banks could be vulnerable to a variety of threats, as they rely on outside firms to carry out critical activities or provide cyber security.
U.S. authorities have tried to seize millions of dollars associated with several companies that deal with North Korea, including the country's military, from eight large international banks, according to court filings made public on Thursday.
The effort was revealed two days after North Korea tested a long-range missile capable of reaching Alaska, ratcheting up tensions with the United States and adding to worries about North
Thursday's filings show that Chief Judge Beryl Howell of the federal court in Washington, D.C. on May 22 granted U.S. prosecutors' applications for "damming" seizure warrants against Bank of America Corp, Bank of New York Mellon (NYSE:BK) Corp, Citigroup Inc (NYSE:C), Deutsche Bank AG (DE:DBKGn), HSBC Holdings Plc (LON:HSBA), JPMorgan Chase & Co (NYSE:JPM), Standard Chartered (LON:STAN) Plc and Wells Fargo (NYSE:WFC) & Co.
World leaders have been warned to guard against another financial crash after a steep rise in risky bank lending over the past year that could threaten the stability of the global financial system.
The international body that represents central banks said a recovery in global trade this year and improving levels of GDP in most countries could create complacency and convince policymakers to ignore warning signs of excessive lending coming from the financial sector.
With only two weeks until the G20 summit of world leaders in Hamburg, the Bank of International Settlements (BIS) said politicians and central banks needed to keep financial markets in check to prevent another crash.
