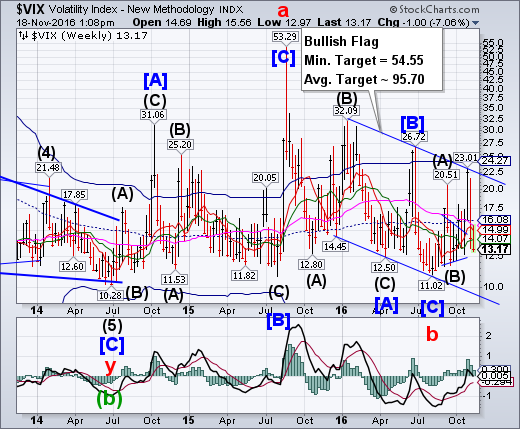
VIX pulled back from its November 4 high where it tested its Bullish Flag trendline.A close above its Intermediate-term resistance at 14.07 puts the VIX on a buy signal while a breakout of the Bullish Flag suggests that the Cyclical uptrend has resumed in earnest.
(ZeroHedge) Near-term volatility expectations have plunged to record lows.
Trader sentiment has officially come full circle following the election. On November 1, we observed that “Investors Are (Over?-)Prepared For Election Volatility”. Our evidence was that the CBOE S&P 500 Short-Term Volatility was trading at near-record levels relative to the 1-Month Volatility Index (VIX). At its peak, the VXST/VIX Ratio would hit 1.35. That marked the 2nd highest reading in the VXST’s 3-year history, trailing only August 21, 2015 (when the S&P 500 was essentially crashing).
SPX rallies, but no new high.
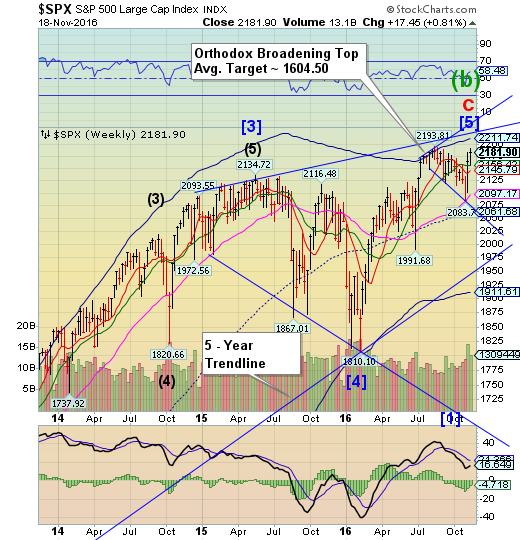
SPX rallied to a high that was just 10 points beneath its August 15 all-time high. Should it decline beneath its Intermediate-term support at 2156.42 without beating its prior high we may be witnessing a truncation.This phenomenon may be very bearish, as it implies exhaustion in the uptrend.
(Bloomberg) U.S. stocks added to the rally sparked by Donald Trump’s surprise election, rising for a second week on speculation the president-elect will introduce policies that will spark brisker economic growth.
The biggest beneficiary has been small caps, with the Russell 2000 Index rallying 11 straight days to cap its longest winning streak since 2003 as the dollar strengthened. The gauge ended the five days higher by 2.6 percent. The S&P 500 Index rose 0.8 percent, with financials again contributing the most to the advance. Technology shares joined the rally after concerns over trade policies faded. The Dow Jones Industrial average edged up for the week after touching a fresh high on Nov. 15.
Nasdaq 100 declines, losing Intermediate-term support.
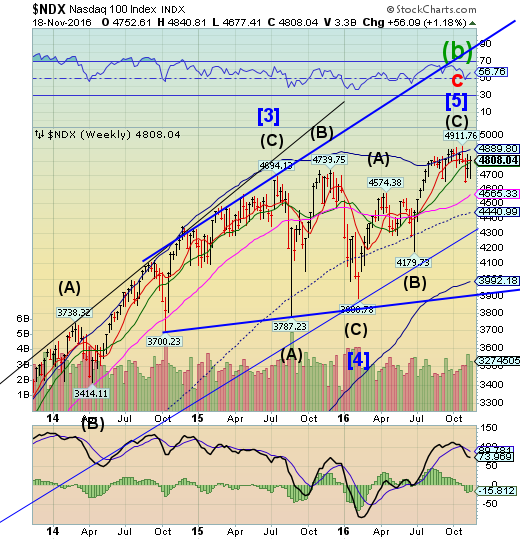
NDX struggled to regain some of its lost elevation this week, closing beneath its weekly Short-term resistance at 4809.50, while the Composite went higher.The decline beneath Intermediate-term support at 4794.75 confirms the sell signal. It may be imprudent to be long beyond this point.
(Mauldin Economics) Profits are the mother’s milk of economic, stock market, and portfolio growth. Employment and tax revenues are driven by profits, too. Nothing good happens unless there are profits and lots of them. So it is no wonder that we pay attention to the earnings of companies in the stock market quite closely.
It’s quarterly report time for US stocks. If you just casually glance at the earnings news, you might think companies are having a great year. Many are beating expectations and reporting impressive revenues and profits. The markets reward companies for meeting expectations (as we shall see below). But the reality is that the S&P 500 is on track for a sixth straight drop in year-over-year earnings. How do companies keep continuing to beat expectations when earnings are falling?
Dow Jones High Yield Select 10 reverses at its Cycle Top.
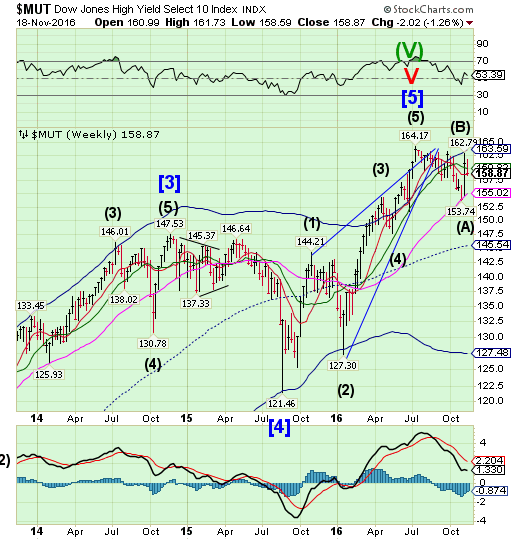
The High Yield Bond Index reversed at its Cycle Top resistance and spent the week declining to Short-term support at 158.64. The Cycles Model suggests more selling ahead, as MUT is on a sell signal.Outflows out of High Yield bonds resumed last week.
(Reuters) U.S. municipal high-yield bond fund outflows set a record during the week ending Nov. 16, with investors dumping the tax-exempt sector as U.S. Treasuries plummeted after the stunning victory by President-elect Donald Trump on Nov. 8, data on Thursday showed.
Investors pulled $1.59 billion out of high-yield muni bond funds, the most ever in a single week since Thomson Reuters' Lipper service began reporting such data in 1992.
Overall, investors took $3 billion out of all muni bond funds, the largest outflows since late June 2013, the data showed.
USB continues its decline.
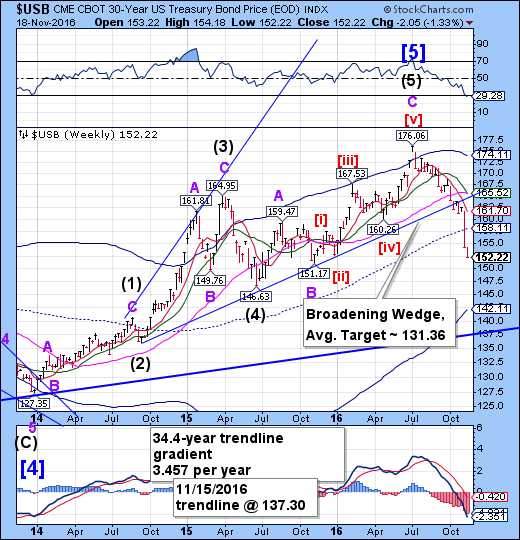
The Long Bond continued its decline extending losses from its July 8 high to over 13.5%..The Cycles Model suggests that the decline may extend for another week before a bounce is possible.The nearest support appears to be the Wave B low at 151.17, but it may go lower
(Zero Hedge) Two weeks ago we warned of the "unintended consequences" of Dodd-Frank which are likely to crush bond market liquidity. On the day of Brexit we got a glimpse of what can happen when the world's most liquid bond market suddenly isn't and as one veteran bond trader exclaimed today, US Treasury market liquidity is "worse than Brexit."
Following the worst two-week loss for bonds... ever...
The bond-market rout triggered by Donald Trump’s election victory has also crimped investors’ ability to trade, according to a Bloomberg index measuring how much U.S. government-bond yields are deviating on average from a fair-value model. By that measure, the deterioration of liquidity in Treasuries has been the most severe since the U.K.’s June vote to exit the European Union...
The Euro tumbles to Cup with Handle.
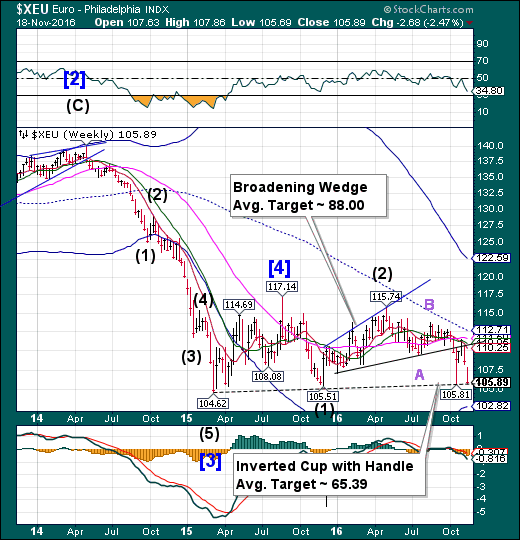
The Eurotumbled to the Lipof its inverted Cup with Handle formation at 89.80. The support at that level may not hold, as the Cycles Model suggests as much as another week of decline. A likely target appears to be the weekly Cycle Bottom at 102.82, suggesting that critical support may be broken.
(Telegraph) The euro has suffered its longest losing streak against the dollar since the single currency came into existence in 1999. The euro's 0.5pc drop in Asian trade to $1.0582 marked the tenth straight daily drop, taking the currency to its lowest level since December 3 last year.
We take a closer look at why the single currency has fallen in value and how low it could go from here.
What's happening in financial markets?
Donald Trump's victory in the US elections has shaken up global markets and triggered what analysts at Bank of America Merrill Lynch have described as a "violent rotation".
Mr Trump hasn't even entered office, but investors believe his programme of tax cuts and infrastructure spending will raise growth and inflation in the US, while his protectionist policies are expected to hit emerging markets.
Euro Stoxx 50 has an inside week.
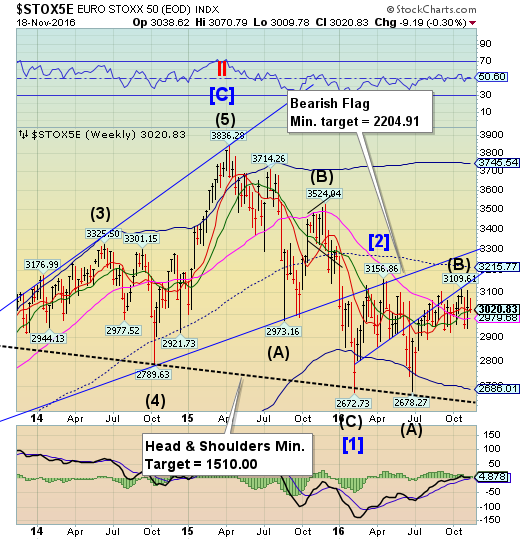
The EuroStoxx 50 Index traded inside the prior weeks’ highs and lows, closing above Intermediate-term support at 3016.40.The right shoulder of a Head & Shoulders formation appears to be well-defined, implying a further decline to the neckline or lower over the next two months.
(WSJ) After Brexit and Donald Trump, investors are focused on Italy as they position themselves ahead of what could be the latest political event to rattle markets and upend politics.
If rejected, a Dec. 4 referendum in Italy has the potential to send the country’s bank shares tumbling, push bond yields up and further weaken the euro.
The vote is on a constitutional overhaul presented by Prime Minister Matteo Renzi that aims to speed up lawmaking and produce more stable governments. Mr. Renzi has pledged to resign in case of a “no” vote. With the economy in the doldrums and the 41-year-old premier’s popularity waning, the referendum has effectively become a confidence vote on the government and its efforts to revive the economy.
The Yen probes for a low.
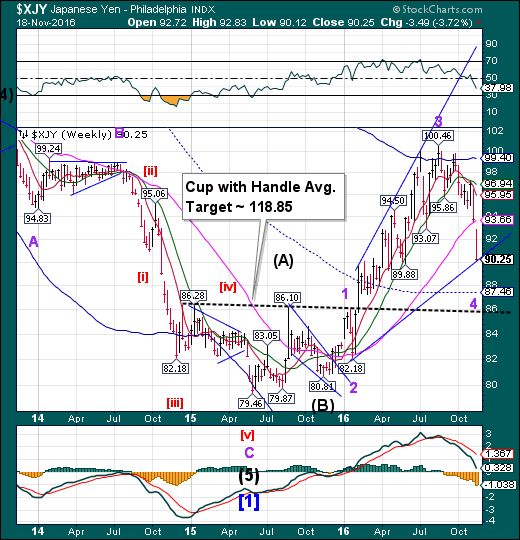
The Yen appears to be probing for a low from which to make its final slingshot move higher.The turn may have already been made or may be complete in the next few days. With it, a new period of strength may emerge, possibly lasting through mid-January.
(WSJ) For a barometer of how the market is viewing the policies of U.S. president-elect Donald Trump, take a look at the direction of the Japanese yen.
The yen depreciated past ¥110 against the U.S. dollar on Friday—the latest in a bout of weakening that has seen the Japanese currency depreciate as much as 10% since Nov. 8, when U.S. voting results rolled in.
That is because investors are betting that Mr. Trump’s proposals to boost spending and growth at home will lead to a higher rate of inflation, faster interest-rate increases and a stronger dollar—an optimistic take on the incoming president’s campaign pledges. Japan is happy about the weaker yen too, since it boosts the global earnings of the country’s many manufacturers in yen terms, which in turn could feed into higher wages and investments at home.
The Nikkei 225 gets a boost from a weaker Yen.
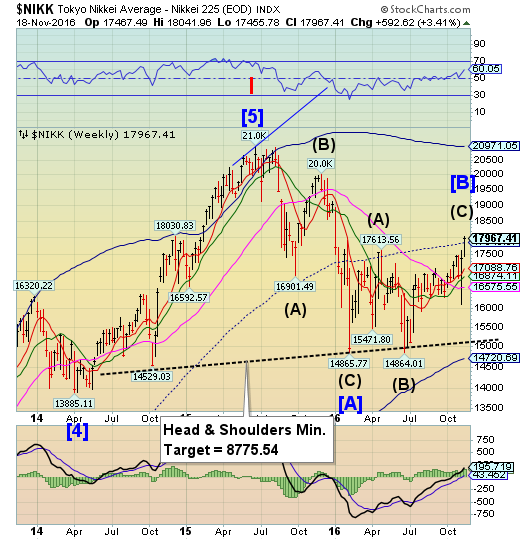
The Nikkei surged past its weekly mid-Cycle resistance at 17845.87 as the Yen plummeted to new lows.But it cannot last.As the Yen finds its bottom, the Nikkei may reverse from strength to weakness. Japan is an export-driven country and a strengthening Yen may curtail the rally. Should the Head & Shoulders neckline be broken, a panic decline may ensue.
(WSJ) Japan’s Nikkei entered bull market territory on Friday, with a weaker yen helping drive gains across key Asian markets as robust U.S. economic data buoyed expectations of an interest-rate increase next month.
The Nikkei Stock Average closed up 0.6% at 17967.41 points, up 20% from its recent low in June and having hit a ten-month high earlier in the session. The Wall Street Journal and many other market watchers call it a bull market when stocks rise 20% off a low point.
U.S. Dollar makes a bid for the Cycle Top.
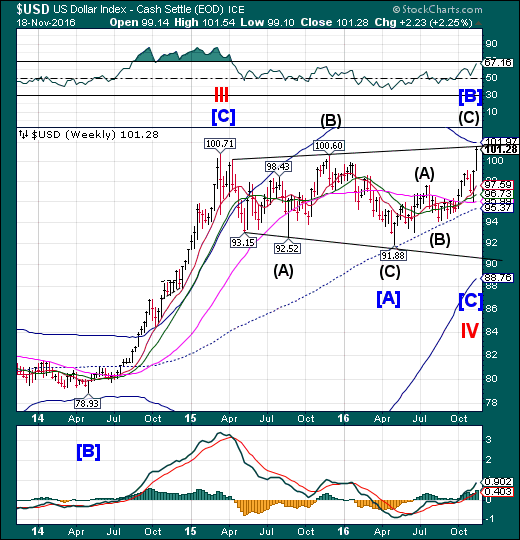
USD may be aiming for its Cycle Top at 101.97 in the next few days. Internal calculations suggest that the average target at 101.40 may have already been made, but trendlines and resistance lines often act as attractors until they are met. The reversal may cause a rapid move from bullish to bearish as traders find themselves wrong-footed.
(WSJ) The dollar extended its powerful rally, spurring central banks in developing countries to take steps to stabilize their own currencies and threatening to create headwinds for the long-running U.S. expansion.
The U.S. currency moved closer to parity with the euro after rising for the 10th straight day, the dollar’s longest winning streak against the euro since the European currency’s inception in 1999. The dollar also moved higher against the yen, which fell to its weakest levels against the U.S. currency since May 30.
Gold appears to be at mid-Cycle support.
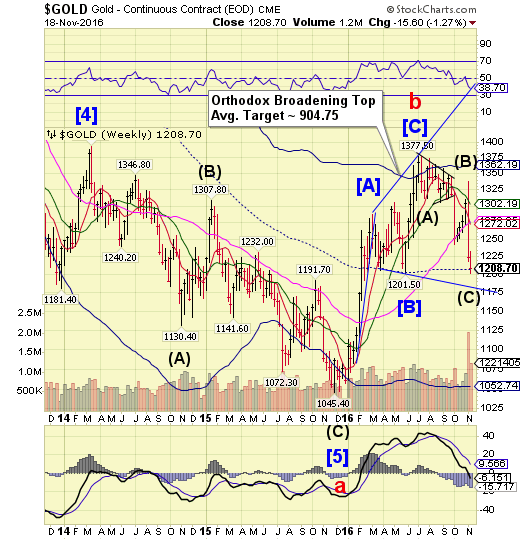
Gold declined dramatically over the past two weeks, finding support at the mid-Cycle line at 1207.47. The Cycles Model offers the probability of a bounce that may not last more than a week or two, followed by a stronger decline.
(Bloomberg) Gold slid to a five-month low and silver neared a bear market as the dollar rallied amid mounting expectation for higher U.S. interest rates.
In her first public statement since the U.S. election, Federal Reserve Chair Janet Yellen said Thursday that the central bank is close to raising rates as the economy continues to strengthen. With a rate hike next month seen as a near-certainty, the dollar and bond yields are rising and investors are selling assets that don’t pay interest.
Crude Oil bounces at Long-term support.
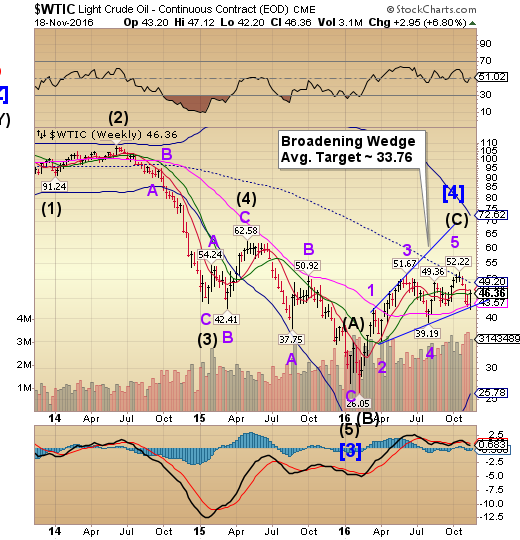
Crude bounced after challenging its Broadening Wedge trendline and Long-term support at 43.57.There may be some residual strength left in this bounce to test mid-Cycle resistance at 49.20. However, a break of these supports sets the next decline into motion.
(CNBC) Oil prices eked out gains despite a stronger dollar and rising U.S. oil rig count, as hopes that OPEC might agree to limit production cuts at the end of the month boosted sentiment.
The Organization of the Petroleum Exporting Countries is moving closer to finalizing its first deal since 2008 to limit output, with most members prepared to offer Iran flexibility on production volumes, ministers and sources said.
Iran has been the main stumbling block for capping production, and while it has not yet responded to the proposal, it suggests OPEC members may be coming nearer to a consensus ahead of their meeting in Vienna on Nov. 30.
Shanghai Composite Index makes a marginal new high Monday.
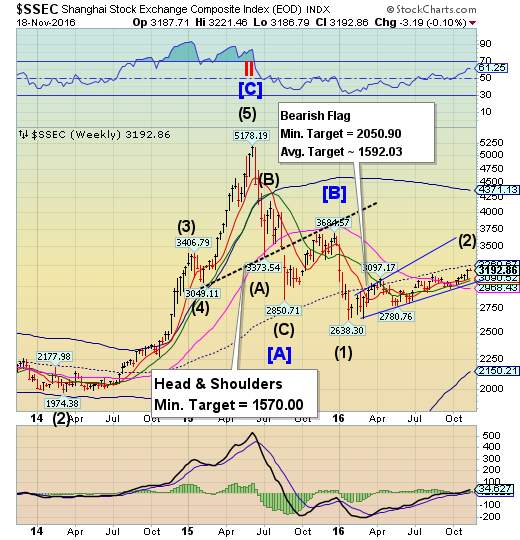
The Shanghai Index made a marginal new high on Monday, creating a Cycle inversion. The fractal Model suggested a probable low on that day. However, this often creates a Cycle compression, where the anticipated low may come within the following two weeks with a vengeance.
(ZeroHedge) It was just one year ago when the biggest worry for the market - which culminated with a near 10% S&P correction in in early 2016 - was the daily plunge in the Yuan driven by the surging dollar, which in turn prompted China to engage in an unprecedented reserve liquidation (in which it sold both government bonds and equities), leading to a daily selloff in risky assets on days when the Yuan was fixed lower.
Fast forward a year later, when the US Dollar has blown through last year's highs and is now at levels not seen since 2003, the Yuan is trading at record lows, just shy of 7.00, and yet stocks stubbornly ignore the one catalyst that led to so much headache for the bulls one year ago.
The Banking Index completes a Broadening Top formation.
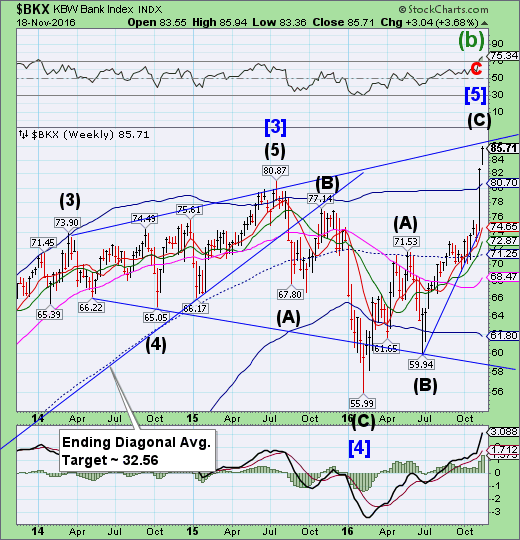
--BKX completed a massive Orthodox Broadening Top formation last week.There may be a few days of residual strength as BKX probes for the upper trendline. Once a reversal is made, we may expect to see a very sharp (possibly a panic) decline.
(Politico) Four major U.S. banks — Goldman Sachs (NYSE:GS), JPMorgan Chase & Co (NYSE:JPM), Morgan Stanley (NYSE:MS) and Citigroup (NYSE:C) — have plotted out their exit plans after Brexit and already have one foot out the door.
“Citi is planning to move people to Dublin, while the other three are going to Frankfurt,” one person familiar with the matter said. “At this stage the discussion isn’t about moving thousands of people, just hundreds; numbers will grow if single market access doesn’t happen.” The source said the first to be moved will likely be the banks’ derivatives trading teams.
Bankers say they love London and don’t want to move.“London is an optimal choice for us. Any other city would be sub-optimal,” a banker at one major U.S. firm said. However, those familiar with the ongoing talks between the City of London, the British government and EU regulators insist things will change sooner rather than later.
(NYTimes) Stocks on Wall Street rose on Thursday as banks resumed their steep upward climb and retailers moved higher. The Federal Reserve chairwoman, Janet L. Yellen, emphasized that the Fed planned to raise interest rates, which would help banks make more money from lending.
Stocks started the day with small gains and moved higher after Ms. Yellen’s testimony to Congress. Banks once again marched higher as investors cheered the latest indication that interest rates would rise from their ultralow levels.
(ZeroHedge) While it won't come as a surprise that Wells Fargo (NYSE:WFC) customers were disappointed to learn their bank was embroiled in the biggest banking scandal since the financial crisis which shattered the bank's "folksy" image, so far there were no definitive numbers to frame the post-settlement reaction.
Earlier today, we finally got the first glimpse into the full scope of the exodus, when the largest US mortgage lender revealed its latest retail metrics, and they were a disaster. The bank reported that retail customers opened 44% fewer new accounts in October relative to a year ago, after the bank’s record-setting settlement with regulators over its cross-selling scandal which cost ex-CEO John Stumpf his job.
The drop was 27 percent compared with September, the bank also reported, while new credit-card applications crashed by 50% to 200,000 in October, the first full month since the lender disclosed the settlement on Sept. 8.
(ZeroHedge) In the latest reminder that 7 years after the financial crisis, the US banking system still remains a systemic risk, Minneapolis Fed President Neel Kashkari today released four-step plan to end too-big-to-fail problem. In his speech to the economic club of New York, the former Goldman banker said that while significant progress has been made to strengthen U.S. financial system, biggest banks continue to pose a significant, ongoing risk to our economy.
Under the “Minneapolis Plan,” there would be “fewer mega banks,” community banks would thrive, and mid-sized banks would make up larger share of system.
