
The US dollar slid, while US and Asian equities traded in the green yesterday and overnight, perhaps due to positive remarks with regards to a coronavirus-aid bill in the US. Positive US data may have also boosted risk appetite. Now, the next event that could enter the limelight may be the US employment report for September, due out on Friday.
US Officials See "A Lot Of Progress" In COVID-Bill Talks
The US dollar traded lower against the other G10 currencies on Wednesday and during the Asian morning Thursday. It lost the most ground versus NOK, AUD, CAD, and GBP in that order, while it underperformed the least against CHF, JPY, and EUR.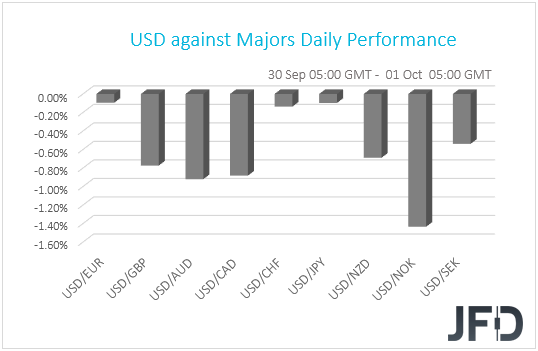
The weakness of the safe-havens dollar and yen, combined with the strengthening of the risk-linked Aussie, suggests that investors’ appetite improved at some point yesterday. Indeed, turning our gaze to the equity world, we see that although most major EU indices closed in negative waters, all three of Wall Street’s main indices traded in the green, closing on average 0.92% higher. The positive morale rolled over into the Asian session today as well, with Japan’s Nikkei gaining 0.44%. China’s, Hong Kong’s and South Korea’s markets were closed.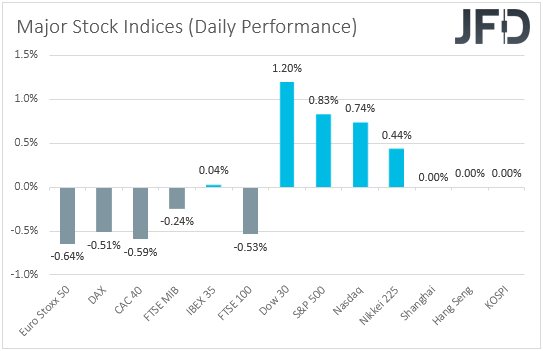
What may have helped investors to increase their risk exposure is positive remarks with regards to a coronavirus-aid bill in the US. Both House Speaker Nancy Pelosi and Treasury Secretary Steven Mnuchin expressed hope for a breakthrough in negotiations, with Mnuchin saying that talks “made a lot of progress”.
Positive US data may have also boosted risk appetite. Yesterday, the ADP reported that the private sector added 749k jobs in September, after gaining 481k in August. This was above the market consensus of 650k. On top of that, pending home sales accelerated to +8.8% mom in August from +5.9%, instead of slowing to +3.2% as the forecast suggested, hitting a new record high.
All this suggests that the US economic recovery remains on track despite COVID infections still rising at a fast pace. That said, we repeat that even though risk sentiment could stay supported for a while more, we are reluctant to trust a long-lasting recovery.
The prospect of more lockdown measures around the globe remains well on the table, while as we get closer to the US election day, investors may start getting more nervous. For now though, the next event that could enter the limelight is the official US employment report for September, due out on Friday.
Expectations are for a decent report, something that could prove somewhat positive for the US dollar. The big question though is how the equity markets will respond. Will they continue gaining on signs that the US economic recovery remains on track, or will they slide on speculation that the Fed may start raising interest rates faster than previously anticipated?
After all, the latest “dot plot” revealed that 4 members saw higher rates in 2023, when the forecast for inflation is at 2%, suggesting that not all policymakers are in support of allowing consumer prices to overshoot their target for some time before they start raising interest rates.
Dow Technical Outlook
The Dow Jones Industrial Average index traded higher yesterday, clearing the upper bound of a falling wedge formation that’s been containing the price action since September 3rd. On top of that, the index moved above all three of our moving averages on the 4-hour chart. These technical signs suggest that the index could continue drifting north for a while more, at least in the very short run.
Currently, the index looks to be heading towards the 28055 resistance zone, the break of which may allow upside extensions towards the 28370 zone, marked by the high of September 16t, or towards the 28605 area, marked by the high of September 4. Another break, above 28605, could carry larger bullish implications, perhaps paving the way towards the peak of September 3, at 29200.
In order to abandon the bullish case, we would like to see a decent retreat back below 27010. Such a move would take the index back below the upper end of the pre-mentioned wedge and may allow declines towards the lows of September 24 and 25, at 26550. If that level is not able to stop the bears, its break would confirm a forthcoming lower low and may set the stage for declines towards the 26020 zone, marked as a support by the low of July 31.
NZD/USD Technical Outlook
NZD/USD traded higher yesterday, breaking above the 0.6613 zone. Overall, the pair has been printing higher highs and higher lows above a newly established upside support line drawn from the low of September 24th, and thus, we would consider the short-term picture to be somewhat positive.
If the bulls are willing to stay in the driver’s seat, we could soon see them challenging the 0.6651 barrier, marked by the inside swing low of September 21st. If they don’t stop there, we may see extensions towards the high of the day after, at around 0.6687. Another break, above 0.6687, could wake up more bulls, who in their turn, could push the battle towards the 0.6735 area, which is defined as a resistance by the highs of September 4 and 15.
On the downside, we would like to see a dip back below 0.6570 before we start examining whether the bears have stolen the bulls’ swords. The rate would already be below the aforementioned upside support line, something that may encourage the bears to dive towards the 0.6540 barrier, which is the low of September 28.
If that barrier is not able to withstand the pressure, its break may allow a test of the 0.6511 level, marked by the low of September 24. Another break, below that key support, would confirm a forthcoming lower low on the daily chart and may target the low of August 20, at 0.6488.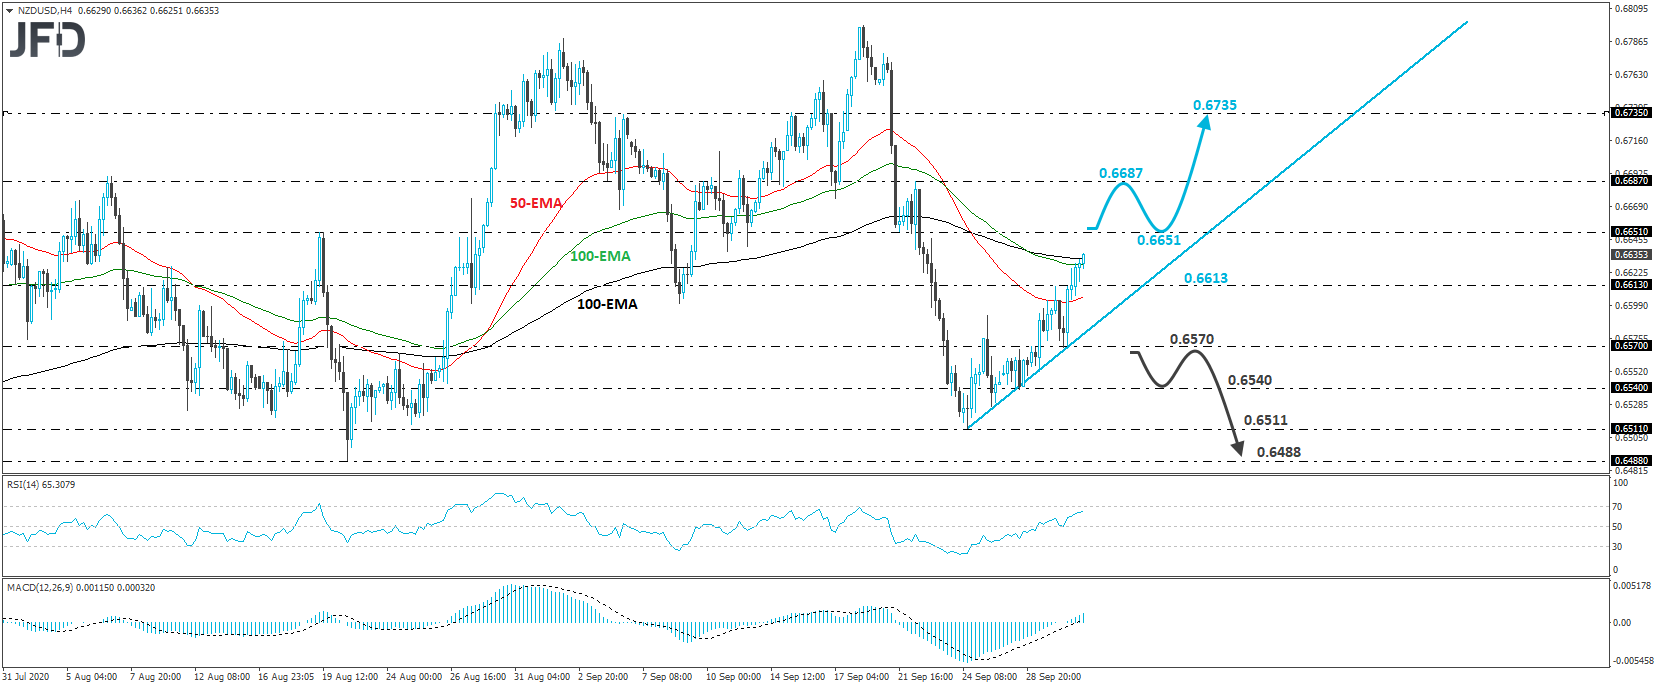
As For Today's Events
Today, we get the final manufacturing PMIs for September from the Eurozone, the UK, and the US. As it is the case most of the times, they are expected to confirm their preliminary estimates.
From the US, we also get the ISM manufacturing index for the month, which is expected to have inched up to 56.2 from 56.0, as well as the personal income and spending for August, and the initial jobless claims for last week. Personal income is forecast to have fallen 2.2% mom after rising 0.4% in July, while spending is anticipated to have slowed to +0.7% mom from +1.9%. Initial jobless claims are forecast to have declined to 850k from 870k the week before. The core PCE index for August is also coming out and it is expected to have ticked up to +1.4% yoy from +1.3%.
As for tonight, during the Asian morning Friday, we get Japan’s employment report for August and Australia’s retail sales for the month. Japan’s unemployment rate is forecast to have ticked up to 3.0% from 2.9%, while Australia’s retail sales are expected to have fallen 4.2% mom after rising 3.2% in July.
We also have five speakers on the agenda: ECB Chief Economist Philip Lane, BoE Chief Economist Andy Haldane, New York Fed President John Williams, Philadephia Fed President Patrick Harker and Fed Board Governor Michelle Bowman.