EUR/USD
The euro is near-term corrective mode after fresh bears broke below 1.2930, 1.2660/ 1.2754 bull-trendline and extended under 1.29 handle, to reach fresh low at 1.2858. Recovery action was supported by yesterday’s positive close, however, no significant upside action would be expected, as long as 1.2987, yesterday’s high and psychological 1.30 barrier stay intact. Hourly studies gained traction, while 4-hour structure remains weak, along with overall negative picture, which keeps focus at 1.2786, Fibonacci 61.8% retracement of 2012/2014 1.2042/1.3992 ascend and 1.2750 zone, Mar/July 2013 lows, higher platform.
Res: 1.2977; 1.2987; 1.3000; 1.3044
Sup: 1.2858; 1.2800; 1.2786; 1.2750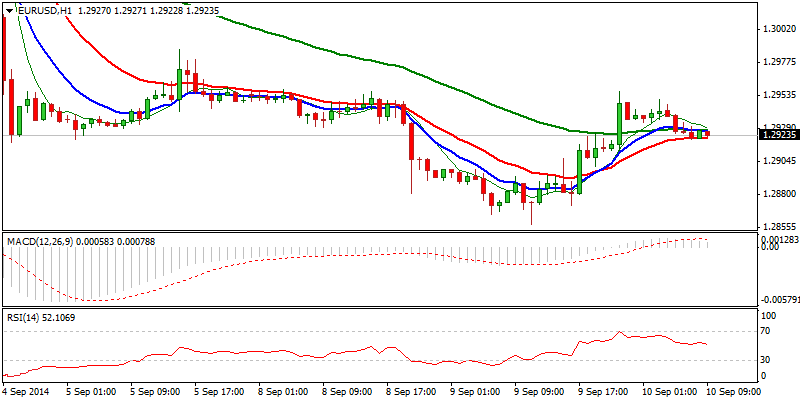
EUR/JPY
The pair trades in near-term corrective phase, following last Thursday’s steep fall, which was contained at135.80, keeping key support at 135.71 intact for now. Bounce through psychological 137 barrier, where the price action accelerated higher and so far reached Fibonacci 76.4% retracement of 138.27/135.80 descend, shifted near-term focus towards psychological 138 and fresh high at 138.27, posted on 03 Sep. Freshly established bulls on lower timeframes are supportive for attempt above 138.27, which is required to confirm double bottom and break above short-term range, for stronger retracement of 145.67/135.71 descend. On the other side, daily technicals are still weak and risk of prolonged range-trade will remain in case of failure under 138.27 barrier.
Res: 138.00; 138.27; 138.43; 138.74
Sup: 137.30; 137.00; 136.60; 136.30 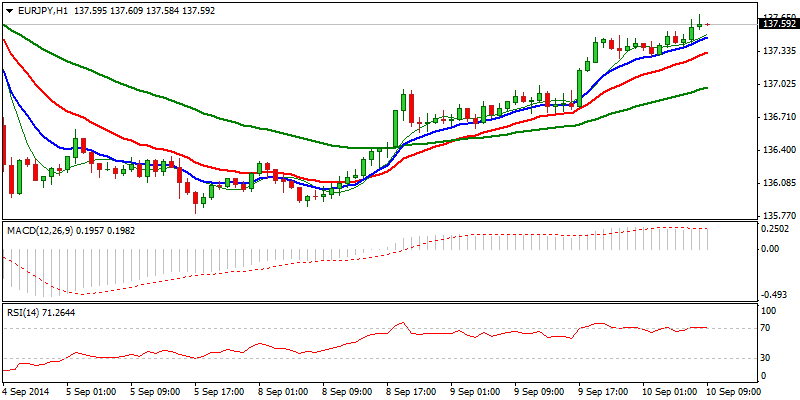
GBP/USD
Cable consolidates recent losses and shows near-term basing attempt at fresh lows, just ahead of psychological 1.6000 support. Upside heading near-term indicators are supportive for stronger corrective action, which was signaled by oversold daily conditions and yesterday’s Doji candle. Confirmation of such scenario requires today’s positive close. Initial resistance lies at 1.6185, 08 Sep intraday high, ahead of more significant 1.6230, week’s high, clearance of which to accelerate attempts of Monday’s gap filling and regain of pivotal 1.6330 lower top. Otherwise, narrow consolidation would be expected to precede eventual attack at 1.60 support.
Res: 1.6185; 1.6230; 1.6280; 1.6300
Sup: 1.6057; 1.6000; 1.5967; 1.5900 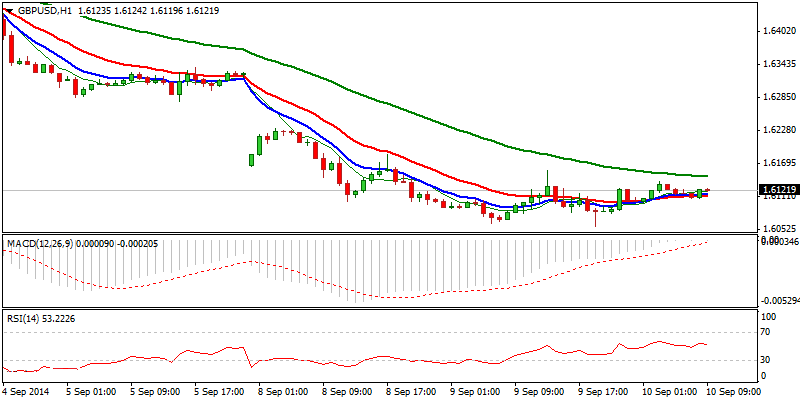
USD/JPY
The pair remains well supported and continues to trend higher, with near-term price action establishing above 106 handle. Fresh gains post new 4-year highs, with upside targets at 107.20, Fibonacci 138.2% projection of the upleg from 100.81 and 108.28, Fibonacci 161.8% projection. Further gains are expected to open Sep 2008 high at 109.10, and lower top at 110.66, posted in Aug 2008. Initial supports lay at 106.00 and 105.70, where dips should ideally find footstep. Otherwise deeper pullback is expected to threaten 105.40, Fibonacci 61.8% of 104.67/106.55 and psychological 105 support, in extension.
Res: 105.70; 106.00; 106.20; 106.50
Sup: 106.00; 105.70; 105.00; 104.70 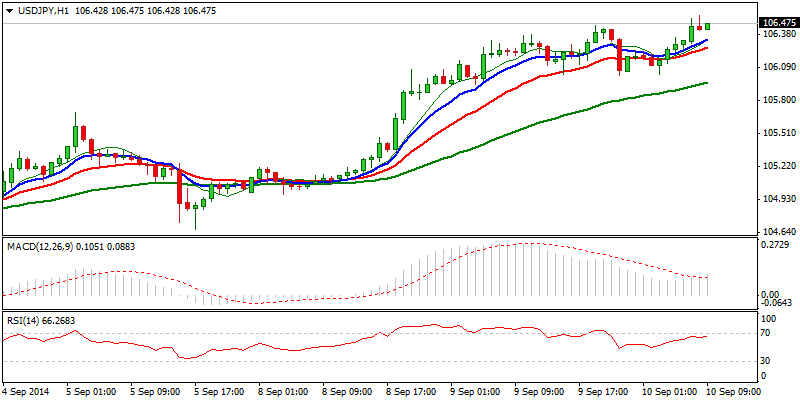
AUD/USD
Near-term structure remains bearish, with increased pressure eventually pushing the price through near-term bases at 0.9237 and 0.9200, as well as 0.9180, Fibonacci 38.2% retracement of 0.8658/ 0.9503 ascend/200SMA. This confirms an end of short-term congestion and further reversal off 0.9503 peak. The price is now looking for extension towards 0.9100, round-figure support and 0.9080, 50% retracement, ahead of 0.9050, weekly Ichimoku cloud base. Overall bearish structure supports the notion, with corrective attempts to face 200SMa as initial resistance, ahead of former bases at 0.92 and 0.9237.
Res: 0.9180; 0.9200; 0.9217; 0.9237
Sup: 0.9100; 0.9080; 0.9050; 0.9000 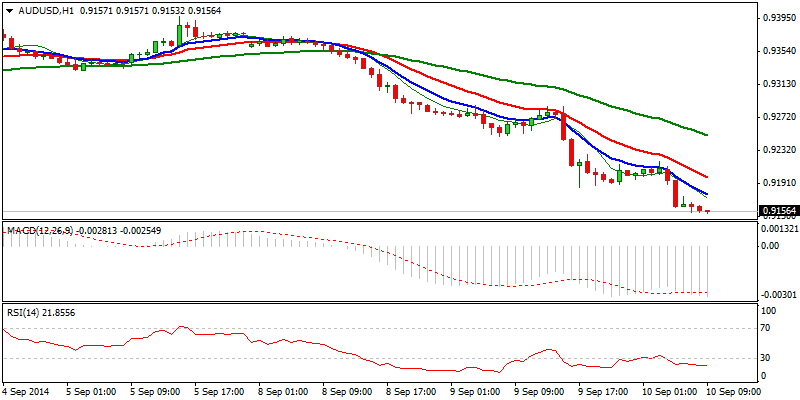
AUD/NZD
The pair extended pullback off fresh high at 1.1294, with higher base at 1.1120 being cracked and price testing 1.1108, 50% retracement of 1.0922/1.1294 ascend / daily Kijun-sen line. Near-term studies are bearish and favor further downside, with break below 1.11 support, to open next significant levels at 1.1045 and 1.1030, previous tops. The notion is supported by formation of Three Black Crows reversal patter, which requires confirmation on today’s close below 1.11 support.
Res: 1.1236; 1.1272; 1.1300; 1.1319
Sup: 1.1100; 1.1045; 1.1030; 1.1000 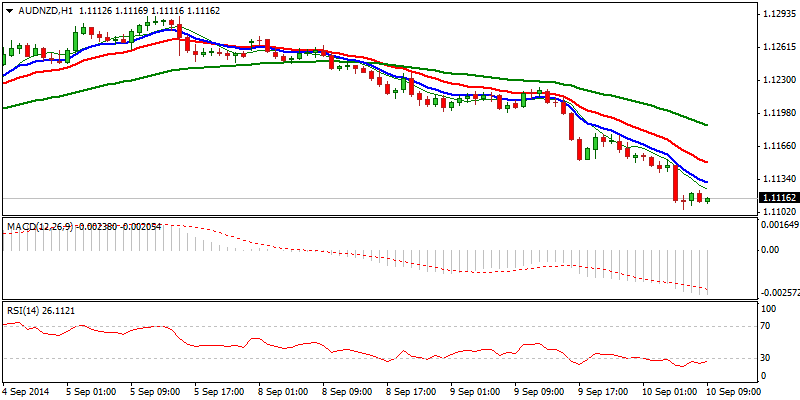
XAU/USD
Spot Gold remains under pressure and resumed the downleg off 1296, 28 Aug lower top, to post fresh low at 1247, en-route to key 1240 support and next target. Near-term price action entered consolidative action, signaled by yesterday’s Doji candle. which is so far capped at 1258, previous low, with hourly 55SMA limiting the action for now. Studies on hourly chart are neutral, while negative tone continues to dominate on 4-hour / daily charts and sees limited upside actions, ahead of fresh weakness. Final push through 1240 support to open 1231/15 targets, while only break above 1266, 61.8% of 1296/1247 and lower platform at 1273, would delay.
Res: 1258; 1261; 1266; 1273
Sup: 1247; 1240; 1231; 1215 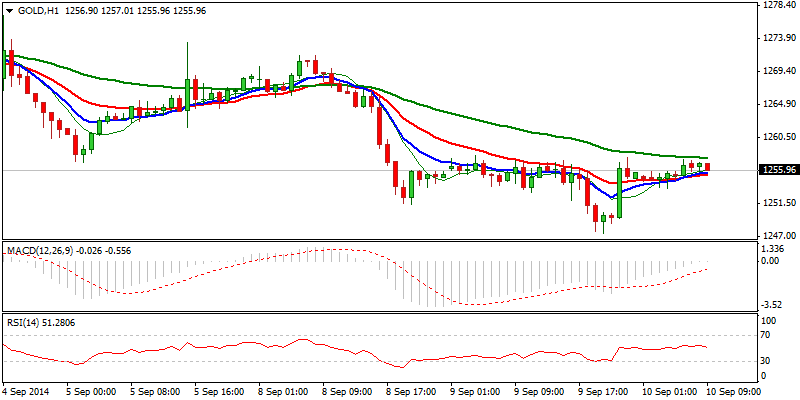
- English (UK)
- English (India)
- English (Canada)
- English (Australia)
- English (South Africa)
- English (Philippines)
- English (Nigeria)
- Deutsch
- Español (España)
- Español (México)
- Français
- Italiano
- Nederlands
- Português (Portugal)
- Polski
- Português (Brasil)
- Русский
- Türkçe
- العربية
- Ελληνικά
- Svenska
- Suomi
- עברית
- 日本語
- 한국어
- 简体中文
- 繁體中文
- Bahasa Indonesia
- Bahasa Melayu
- ไทย
- Tiếng Việt
- हिंदी
USD/JPY Continues To Trend Higher; Gold Remains Under Pressure
Published 09/10/2014, 04:25 AM
Updated 02/21/2017, 08:25 AM
USD/JPY Continues To Trend Higher; Gold Remains Under Pressure

FinFX
3rd party Ad. Not an offer or recommendation by Investing.com. See disclosure here or
remove ads
.
Latest comments
Install Our App
Risk Disclosure: Trading in financial instruments and/or cryptocurrencies involves high risks including the risk of losing some, or all, of your investment amount, and may not be suitable for all investors. Prices of cryptocurrencies are extremely volatile and may be affected by external factors such as financial, regulatory or political events. Trading on margin increases the financial risks.
Before deciding to trade in financial instrument or cryptocurrencies you should be fully informed of the risks and costs associated with trading the financial markets, carefully consider your investment objectives, level of experience, and risk appetite, and seek professional advice where needed.
Fusion Media would like to remind you that the data contained in this website is not necessarily real-time nor accurate. The data and prices on the website are not necessarily provided by any market or exchange, but may be provided by market makers, and so prices may not be accurate and may differ from the actual price at any given market, meaning prices are indicative and not appropriate for trading purposes. Fusion Media and any provider of the data contained in this website will not accept liability for any loss or damage as a result of your trading, or your reliance on the information contained within this website.
It is prohibited to use, store, reproduce, display, modify, transmit or distribute the data contained in this website without the explicit prior written permission of Fusion Media and/or the data provider. All intellectual property rights are reserved by the providers and/or the exchange providing the data contained in this website.
Fusion Media may be compensated by the advertisers that appear on the website, based on your interaction with the advertisements or advertisers.
© 2007-2024 - Fusion Media Limited. All Rights Reserved.