The US dollar was seen trading mixed on Monday as the currency pair managed to ease back against the euro currency and was also seen trading weaker against the Japanese yen. Compared to other currencies including precious metals, the greenback managed to hold its ground.
Economic data was limited on Monday with only the new home sales report showing an increase of 689k which beat estimates of 665k increase.
Looking ahead, the economic calendar is relatively quiet for the day. From the Bank of England MPC members, Haskel and McCafferty are expected to speak over the day. McCafferty was one of the dissenting votes at last week's BoE meeting who voted in favor of a rate hike. Therefore, his comments could be on the hawkish side.
Data from the eurozone is quiet and in the US trading session the S&P/CS housing price index data is expected to be released. The conference board will be releasing its consumer confidence data which is expected to slip slightly to 127.6.
FOMC member, Bostic is due to speak later in the evening.
EUR/USD intra-day analysis

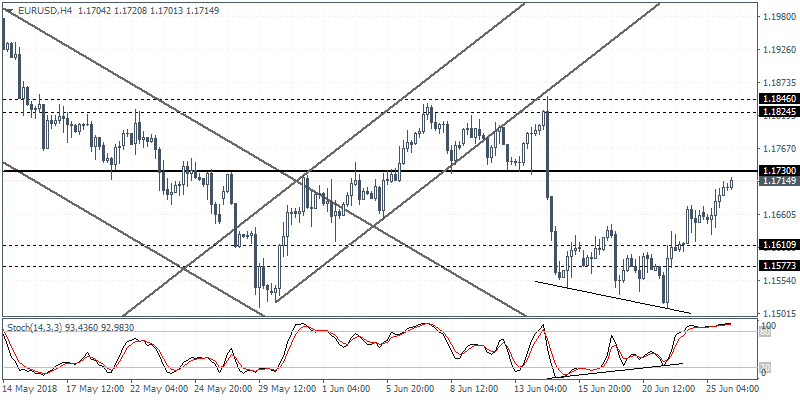
EUR/USD (1.1714): The EUR/USD currency pair was seen extending the gains on Monday amid lack of any clear fundamentals. The currency pair was seen rising to intraday highs marking a 7-day high. With price action seen approaching the resistance level of 1.1730 and with the 4-hour Stochastics posting a hidden bearish divergence, we expect to see some near-term declines. The support at 1.1610 remains in sight as price action is likely to establish support at this level ahead of further gains. If the EUR/USD breaks out above 1.1730, then we expect to see the gains extending to the next resistance level of 1.1846 - 1.1824.
USD/JPY intra-day analysis

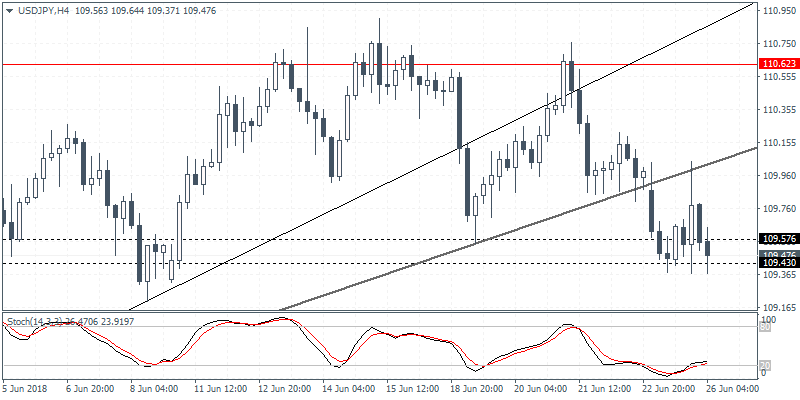
USD/JPY (109.47): The USD/JPY currency pair was seen extending the declines as price action was seen consolidating near the support level of 109.57 - 109.43 region. A breakout from this support level could signal further declines as USD/JPY could be seen falling to the lower support level at 108.90. To the upside, the gains are likely to be limited to the rising trend line which could now act as dynamic resistance. This also coincides with the minor resistance level likely to be formed near 109.95 region.
XAU/USD intra-day analysis

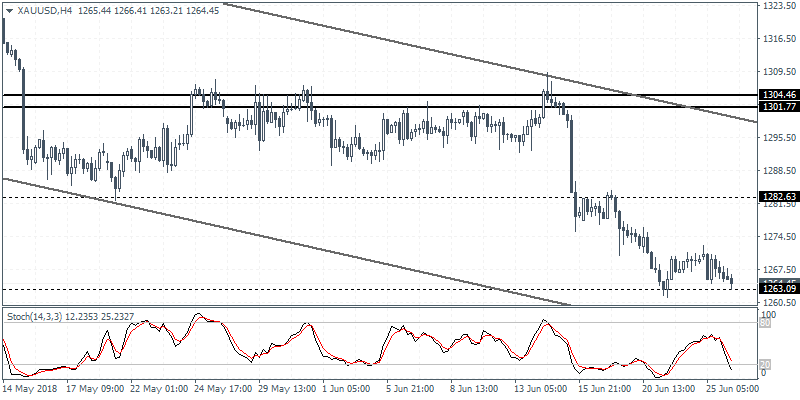
XAU/USD (1264.45): Gold prices failed to capitalize on the modest gains made as price action was seen giving up the gains. Gold prices extended the declines and can now be seen retesting the previously established lows of 1263. A rebound off this support level could potentially a bottom taking shape with the 4-hour Stochastics currently posting a higher low against the lower low in price. The resistance level near 1282.50 is the most likely upside target. However, if price breaks down below 1263 then we can expect to see further declines pushing the price down to 1250.00 level of support.
