
EU and US indices were a sea of green yesterday, after US President Trump said that talks with Congress over further covid relief have restarted, adding to hopes that some sort of agreement could come before the Nov. 3 presidential election.
In the currency world, CAD and NOK were the main gainers, aided by strong gains in oil prices. As for today, CAD-traders are likely to pay extra attention to Canada’s employment report for September.
Equities March Higher On Stimulus Hopes
The US dollar traded lower against all the other G10 currencies on Thursday and during the Asian morning Friday. It underperformed the most versus CAD, NOK, AUD, and NZD in that order, while it lost the least against EUR, JPY, and CHF.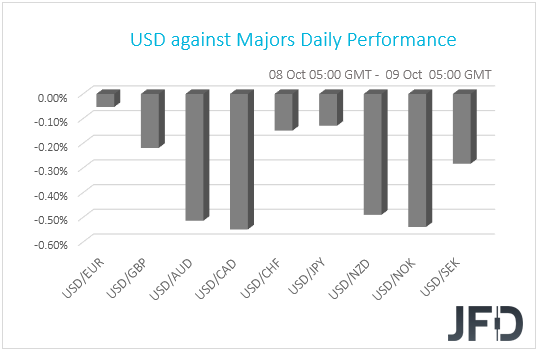
The strengthening of the risk-linked and oil-related currencies, combined with the weakness in the safe havens, suggests that the financial community traded in a risk-on manner for another day. Indeed, looking at the equity sphere, we see that major EU and US indices were a sea of green.
That said, investors’ risk appetite softened somewhat during the Asian morning today. Japan’s Nikkei 225 and Hong Kong’s Hang Seng slid 0.21% and 0.25% respectively, while South Korea’s KOSPI stayed closed. China’s Shanghai Composite surged 1.70%, but this was mainly a catch up after a week-long holiday.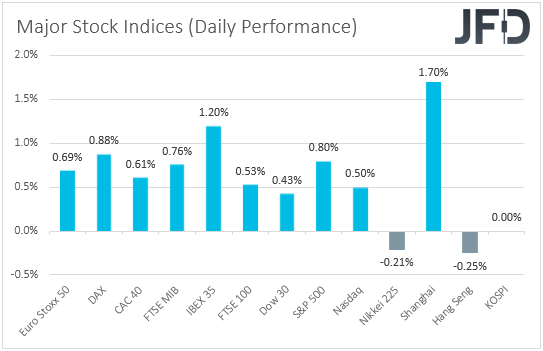
Once again, the driver behind the advance in equities and other risk-linked assets was hopes over more US stimulus, with investors ignoring the fact that covid infections hit a new daily record yesterday. In an interview with Fox News, US President Trump said that talks with Congress over further covid relief have restarted and that there was a good chance for a deal to be reached. These comments come two days after the President called off negotiations on a comprehensive fiscal package, and a day after he urged Congress to pass partial, standalone, bills.
Yesterday’s remarks added to hopes over more fiscal stimulus in the US, allowing market participants to increase their risk exposure. However, our view remains the same as yesterday, and the day before. Yes, equities could continue to gain for a while more, but we are reluctant to call for a long-lasting boost.
We prefer to stick to our day-by-day approach. Coronavirus cases hit a new record yesterday and the US election day is getting closer, risks that add to the uncertainty over the stock market’s future performance.
DJIA Technical Outlook
DJIA continues to grind higher, while balancing above its short-term tentative upside support line taken from the low of Sept. 25. Even if the rate corrects a bit lower, as long as that upside line stays intact, the outlook could remain on the positive side, at least for a while more. Hence our somewhat bullish approach for now.
As discussed above, if the aforementioned upside line continues to provide support, the upside scenario could remain on the table. If the price is able to rise above the 28605 barrier, marked by the high of Sept. 4, that would confirm a forthcoming higher high and might attract a few more buyers into the game.
DJIA may then travel to the 28809 obstacle, or even to the 29019 zone, marked by an intraday swing low of September 3rd. The price might stall there for a bit, however, if the buyers are still confident in themselves, then they could easily lift the index to the highest point of September, at 29195.
Alternatively, if DJIA breaks the previously mentioned upside line and slides below the 28079 hurdle, marked by the high of Oct. 1, that may spook the remaining bulls from the field for a while. This might lead the price to the low of Oct. 6, at 27652, which could halt the fall for a while.
That said, if that is only a temporary occurrence, a break of that hurdle may send the price to its next possible support area between the 27161 and 27250 levels, marked by the lows of Sept. 30 and Oct. 2.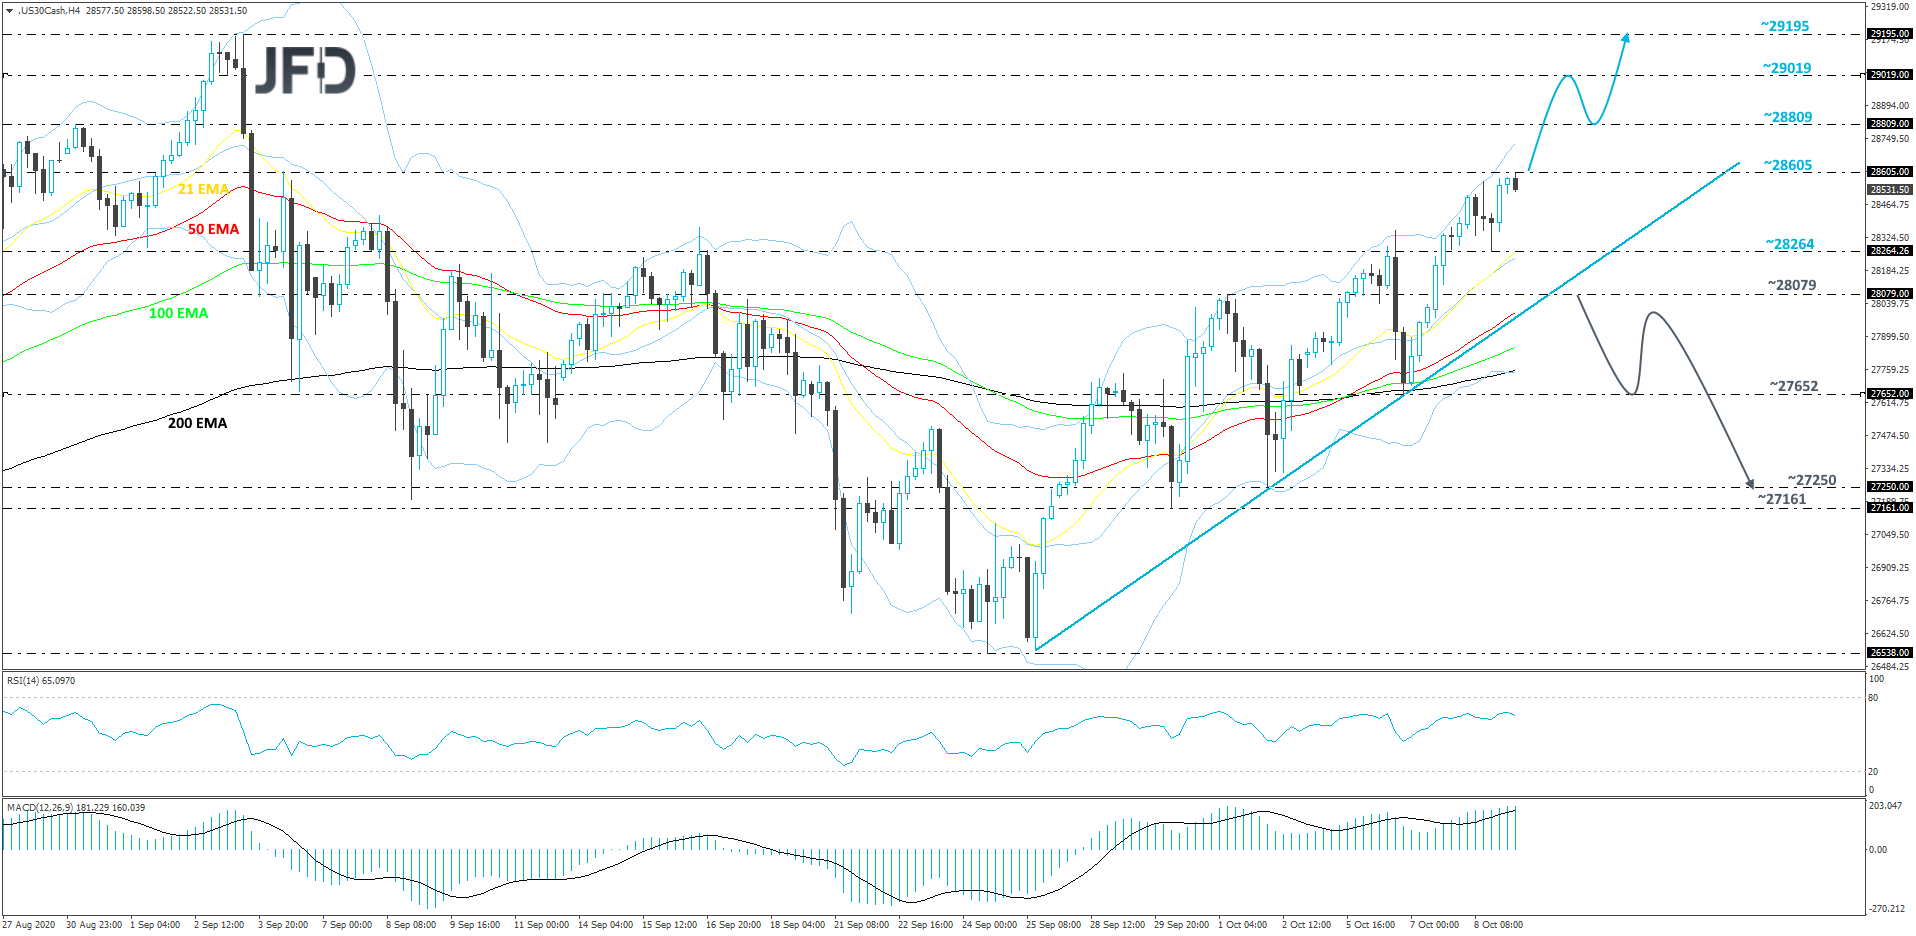
Canada's Jobs Data Enters The Limelight
Back to the currencies, the oil-linked CAD and NOK were the main gainers, aided by strong gains in oil prices. Both Brent and WTI rose 3.22% and 3.10% yesterday, propelled by a strike in Norway that raised the prospect of supply cuts, as well as by the potential impact on US production of Hurricane Delta, which is expected to strike the Gulf Coast today.
As for today, apart from developments surrounding the strike in Norway and the Hurricane, CAD-traders are likely to pay close attention to Canada’s employment report for September as well. The unemployment rate is forecast to have declined to 9.8% from 10.2%, while the net change in employment is expected to show that the economy added 153.3k jobs, less than August’s 245.8k, but still much more than the pre-covid monthly numbers.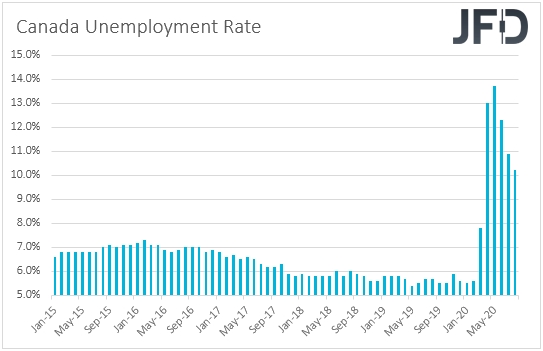
At its prior gathering, the BoC kept interest rates unchanged at +0.25%, repeating that they will stay there until the 2% inflation target is sustainably achieved. They also reiterated the view that they will continue with their QE program until the economic recovery is well underway, and that they stand ready to adjust their programs if market conditions change.
They said that both the global and Canadian economies are evolving broadly in line with the scenario outlined in July, but added that the bounce-back in activity in the third quarter looks to be faster than anticipated in July. With all that in mind, and also taking into account that the core and common CPIs for August accelerated somewhat, a decent employment report may allow BoC policymakers to continue sitting comfortably on the sidelines for a while more.
USD/CAD Technical Outlook
From the beginning of October, USD/CAD is still moving south, while trading inside a short-term downside channel. For now, as long as the boundaries of that pattern maintain the pair’s price action, we will continue aiming slightly lower, hence our bearish approach.
USD/CAD might end up moving a bit lower, where it could test either the lower side of that channel, or the 1.3171 hurdle, marked by the low of Sept. 21. That area may provide a temporary hold-up from which the rate could rebound back up a bit. That said, if USD/CAD finds it hard to move closer to the upper bound of the previously-mentioned channel, this may result in another slide. If so, the pair might overcome the 1.3171 zone and target the 1.3127 level, marked by the low of September 16th.
In order to aim for the upside, at least in the near term, we would like to see a violation of the upper side of that channel and push above the 1.3273 hurdle, marked by intraday swing highs of Oct. 6 and 7, which might help attract more buyers. Such a move would also place USD/CAD above all of its EMAs on the 4-hour chart, possibly clearing the path towards the 1.3313 area, marked by an intraday swing low of Oct 7. If the acceleration doesn’t stop there, the next potential target could be at 1.3340 level, which is the current highest point of October.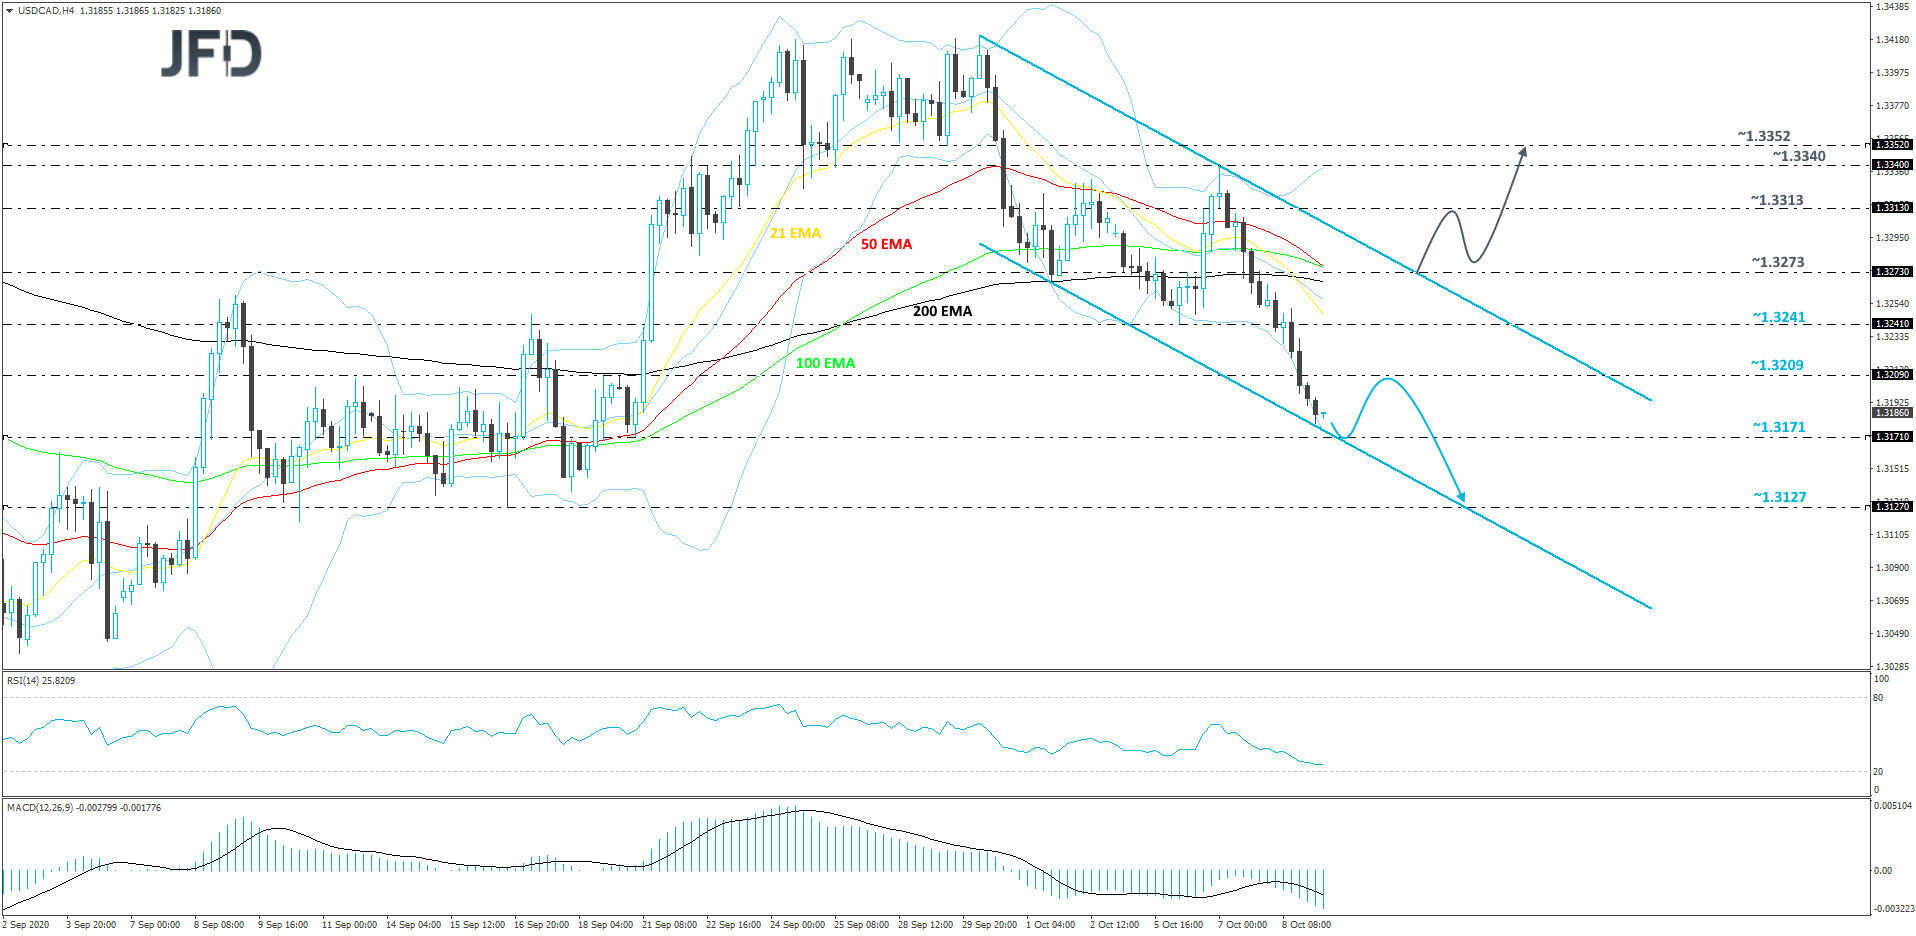
As For The Rest Of Today's Events
During the early European session, we already got the UK’s monthly GDP for August, alongside the industrial and manufacturing production rates, and the trade balance for the same month. GDP slowed to +2.1% mom from +6.6% in July, while both the IP and MP yoy rates increased, but less than the forecasts suggested. The nation’s trade deficit widened somewhat.
Having said all that though, the British pound did not react on these releases. We believe that the currency stays mostly linked to politics, and especially developments surrounding the Brexit landscape.
Last Thursday, the pound tumbled following headlines that the EU and the UK failed to close their differences-gap in the latest round of trade talks, and that the EU began legal proceedings over the UK’s plan to override key elements of the withdrawal agreement. However, it rebounded on Friday, after German Chancellor Angela Merkel said that she remains optimistic that a deal in the EU-UK post-Brexit relationship is still possible before year-end.
What’s more, EU chief Brexit negotiator Michel Barnier suggested that talks could continue up until the end of the month, even though the two sides have set a mid-October deadline for reaching common ground. Thus, GBP-traders are likely to focus more on whether there will be more talks and whether we will see some progress in the next few weeks.