The whole idea of Trend Line Analysis is to capture the price action over the naked charts and find the most optimum zones for buy or sell. The trend line analysis done on the candle stick charts simply light the path for the price to travel.
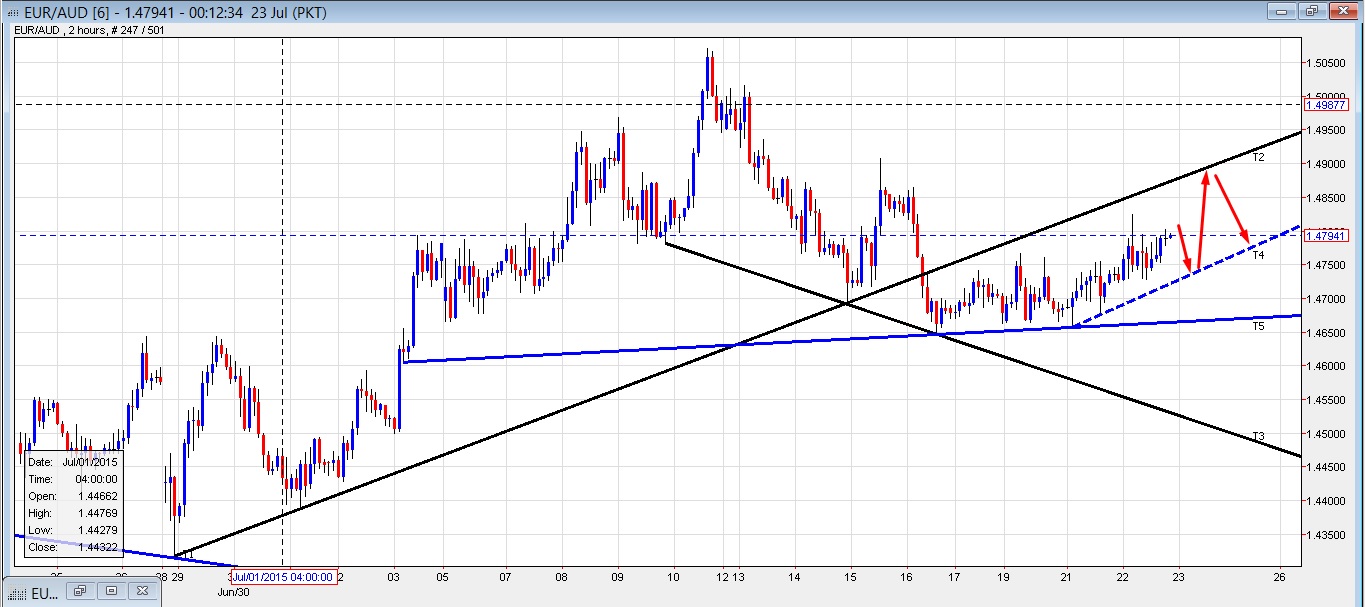
We are looking to set shorts on the pair to 1.489X level with an initial soft target to 1.4820 with potential run lower to 1.476X.
Dovish comments from RBA has put Aussie on defensive mode; but Euro on the other hand is not doing any better. However considering there is pressure on the Aussie and looking technically, we believe the pair can make a run for a 1.489X level and shorts off to it can provide a good risk to reward opportunity.
Alternatively can look to buy if price test 1.472X and shows a hold to it for an initial soft target of 1.4800-10; with potential run higher towards 1.489X.
Considering RBNZ likely to cut rates from 3.25% to expected 3.00%; there can be volatility spilling across to it’s bigger neighbor Aussie and we can see some movement on it as well in early ASIA today.
To reiterate; we prefer to set shorts from 1.489X zone for an overall target of 1.476X; but alternatively can look to buy only if we see a test of 1.4720-30 and a hold to consider going long. We can look for swing play to either side.

EUR/AUD 2 hrs – Looking for 489X to set shorts
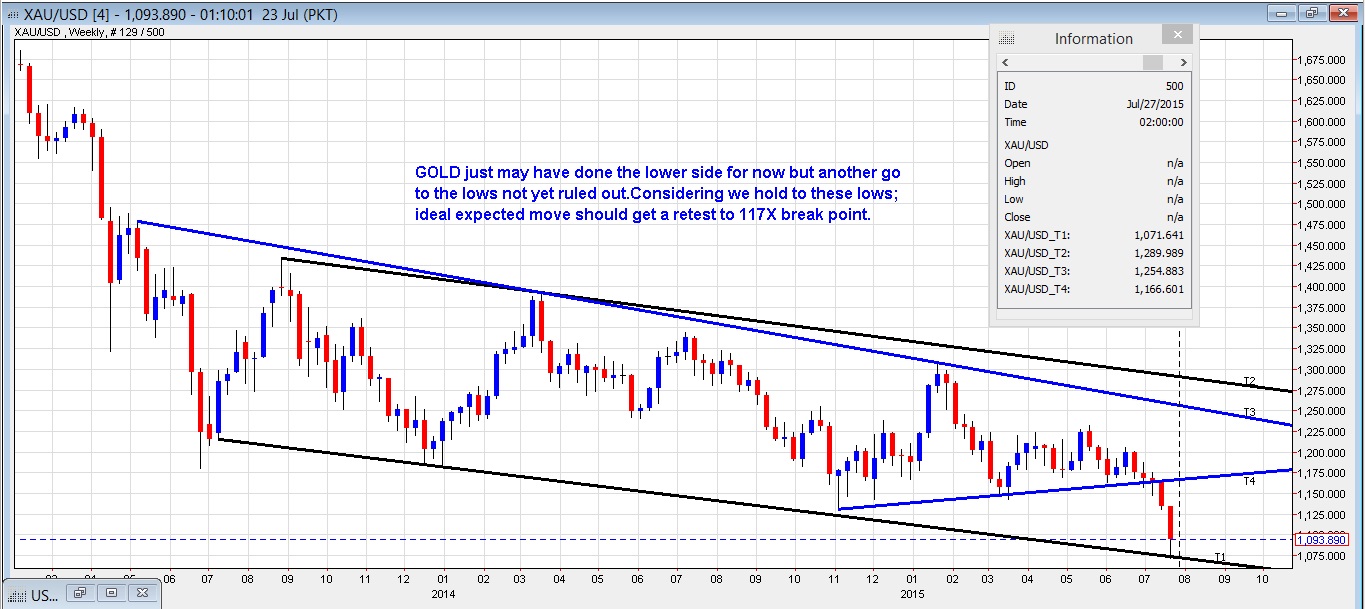
We like to see a re-test to the yearly lows around 1069-71 and a hold to enter longs for an initial soft target to 113X; extended to 1168-70.
We do feel gold is on shaky grounds with US likely to raise interest rates and gold failing to maintain/show it’s safe-heaven status.To add fuel to the fire; China the biggest buyer of gold in the past started reducing the reserve which was one of the main cause of the heavy decline of 60 USD in a minute earlier this week.
However looking from technical point of view; we feel that gold just may have found a temporary bottom and can possibly try to stage a rally for a 1137-40 level.
Thus any revisit to the yearly lows and a hold; offers attractive risk to reward opportunity to long gold for a decent 70 to 100 USD move up north.

GOLD Weekly – Channel support to 1070 attractive for longs
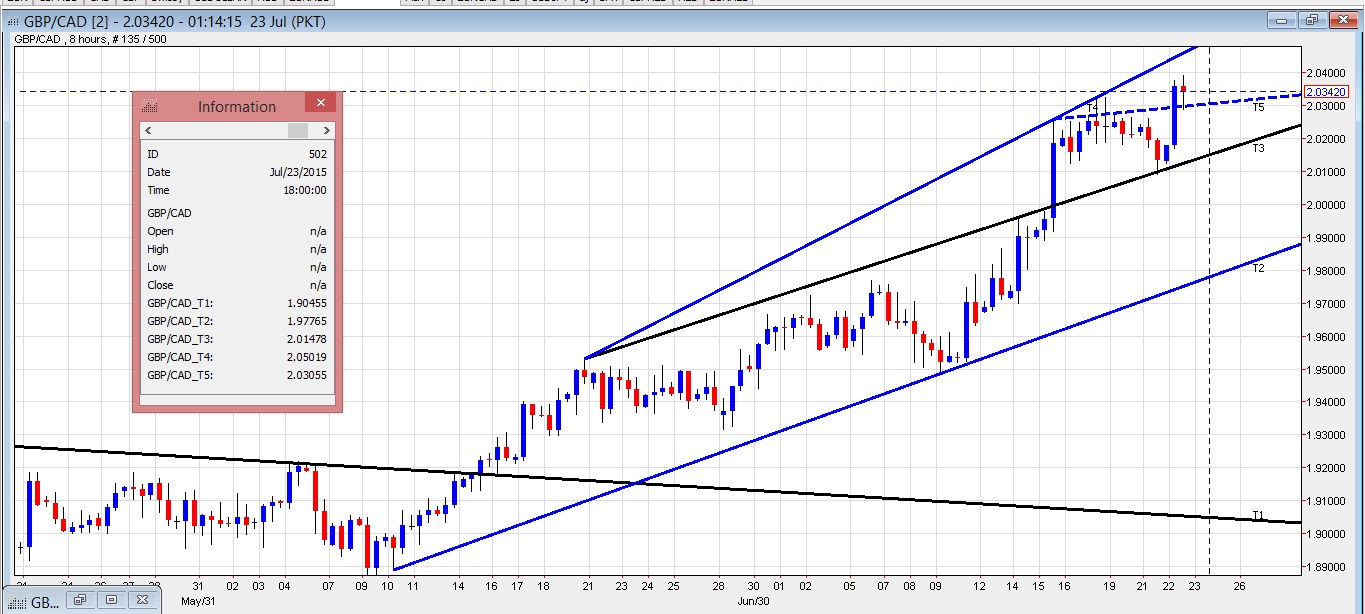
We feel that GBP/CAD just might be putting in a temporary top to around 2.0500 handle and as such we like to attempt a short off this level.
We were looking to buy earlier for this expected move higher, managing an initial break to lower side for shorts but the pair staged an earlier rally of the black trend line coming in as support.
Today could be a busy day for the pair for we have UK Retail Sales early in the European Session and better than expected numbers can stir a rally on the GBP/CAD or vice versa. Later, we have hard hitting releases from CAD as well in the shape of Retail Sales and Core Retail Sales. Thus we feel with the pair been at the yearly highs which is now also the 6 year high, it carries potential for a move to around 2.0500 handle which is the expected top of the channel.
Hence; we like to see a move towards 2.0500 to try shorts off the expected top off for the day for an initial move towards 2.039X with potential run lower towards 2.0300 handle

GBP/CAD 8 hrs – 2.0500-05 decent resistance to set shorts
