The capitulation ‘we had to have’
Are we witnessing the start of the ‘final capitulation’ these markets have been waiting for? Trade would suggest yes.
I have been discussing this very scenario with colleagues and peers over the past few weeks and we all have a similar take on what we could possibly transpire in a final capitulation scenario.
The key points of a final capitulation scenario are as follows:
A shake out of the final pockets of the market that have been holding and are forced to sell out or fear finally wins out.
A further technical correction in hyper-inflated equities. High P/E names are finally being asked to justify price; FANG are classic examples, as are bio-medical stocks and financial institutions. The narrow trades in high P/E names are a risk at any price in the current market, in my opinion.
The central bank ‘life support’ trade of the past eight years has now created this ‘coma-like’ scenario were markets cannot return to normal trading and have been tracking sideways since August.
The artificial support from central banks is at a crossroads - central bank intervention will no longer create the holding pattern of the past year; markets now believe banks are out of ammunition.
The artificial support from central banks has fed banking stocks; the current conditions now have banking stocks facing a ‘crisis’ globally.
The questioning of Deutsche Bank's (N:DB) capital position is a major development. The fears of a liquidity collapse and widening spreads will see more private banks fingered. Market rumours are that Credit Suisse (VX:CSGN) is the next in line to have the ruler run over it.
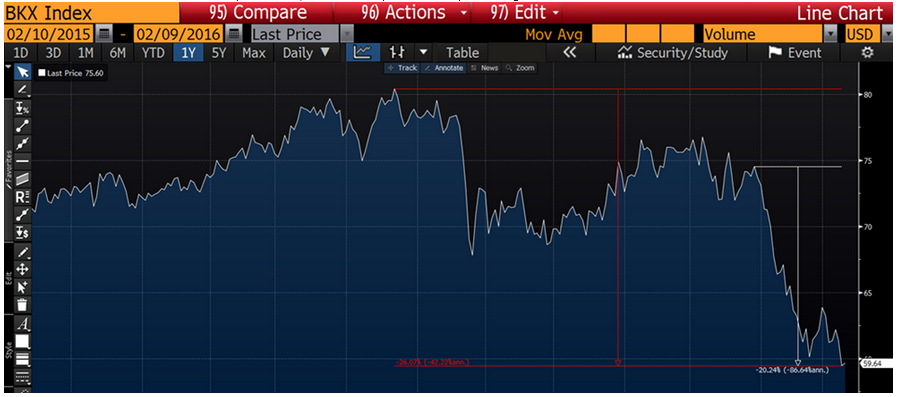
American banks have lost over 20% in the year to date, as have the top three worst-performing sectors.

Credit spreads and funding issues are ramping up. Fears of a stalling US economy increasing the risk of bad and doubtful debts will all added to the selling pressure.
The JPY and NKY were shaken to the core yesterday – is this a translation of China market risk? JGBs on the long end of the curve dipped into negative yields for the first time ever. A BoJ ‘emergency meeting’ must be a second capitulation away.
This isn’t good for Asian trading, considering Lunar New Year will create a bottleneck trading scenario. The prospect of Asian markets overshooting on their reopening after LNY is an increasing risk and will only accelerate the ‘final capitulation’ trade.
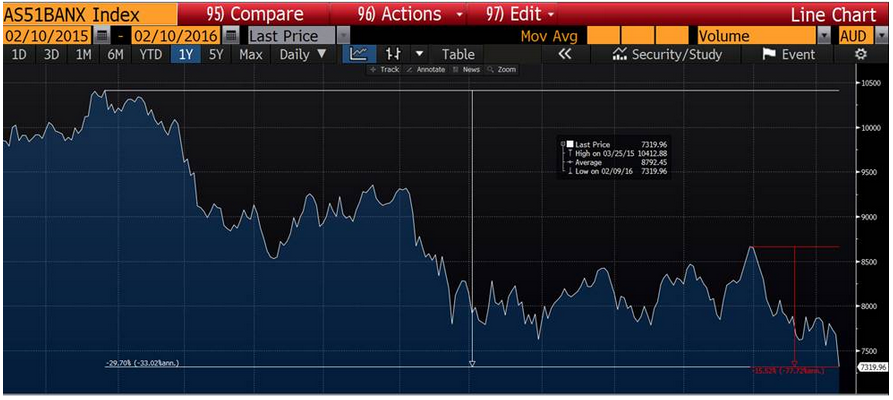
Australian banks are being swept up in the global banking selloff. This is interesting considering Australian banks are not as exposed to liquidity issues as their US and European counterparts. The reliance on the long end of the bond curve and wholesale funding is substantially lower for Australian banks – their retail exposure actually isolates them from funding risk.
However, Australian banks have now declined 15.2% year-to-date and almost 30% since the April 2015 high.

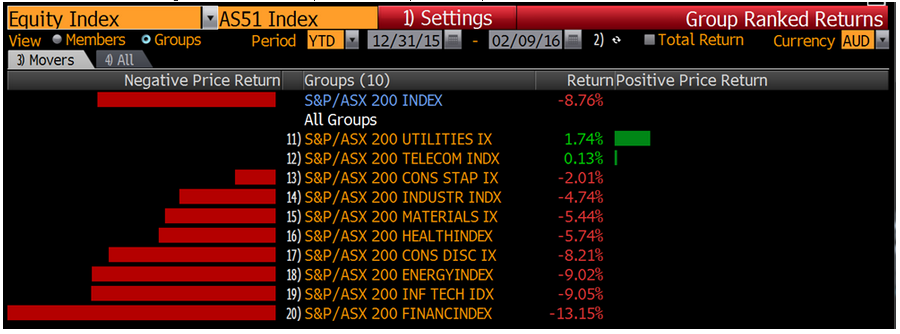
Whats more interesting is the financial sector’s performance compared to ASX peers.
ASX sector performance:

Underperforming energy with oil prices at the lowest level in a decade by 413 basis points shows how overprice the market believes the banks space has become.
Yields: The investment reasoning from 2011 is failing to support Australian banks in any form. AX:CBA now has a net yield of 5.75% - the highest level since mid-2013. AX:NAB has a net yield of 6.75% - its highest yield since mid-2012. Westpac's (N:WBK) 6.5% net yield is the highest since 2012.
I have been expecting the ASX to hold on to yield support at 4850 as the aggregated net yield of the ASX hits 5% - the highest level since 2011. In the final capitulation scenario that is playing out, test this hypothesis to the full.
