“I just want you to stand there and admire me for a while.” – Ace Lannigan (Bob Hope) in The Road to Singapore
So the November jobs number was the biggest in years. From what I could see, the consensus opinion in the business media in the wake of the report was fairly definitive: This Is The Big One. Employment, the economy (and presumably stock prices) are entering a new leg of long-lived growth. How long? Why, very long sir. We’re quite sure of it. How many shares are you buying?
A strong undercurrent of the victory theme is that anyone who is not celebrating is a hopeless crank of one form or another. Gee, do I have to be in the cranky camp now, along with the Fed-haters and goldbugs? It was a good report, the one I thought we would get last month, but the truth be told, I don’t think it was really much better than the November 2013 report and not nearly as good as the cheering parades on Wall Street would have it – for example, the unemployment rate remained steady at 5.8% and the jobs seemed to be heavily weighted towards part-time work. There’s a lot more detail below in The Economic Beat.
The bond market didn’t seem all that impressed either, with the U.S. 10-Year yield nudging up five basis points to 2.31%, half of one percent lower than this time a year ago. Yes, yes, oil is down, the dollar is up and that makes Treasuries more attractive, no argument. But there is no evidence at all that the bond market is concerned about economic growth taking off.
But what does the economy matter? Last Thursday, markets sold off briefly when European Central Bank (ECB) President Mario Draghi talked vaguely about the much-anticipated plans to add sovereign bond-buying to quantitative easing (QE). He cautioned that while preparations were underway, one should not assume that it would begin in January. Disappointment, as stocks were anticipating the start of QE all week. But then a story was floated over just in front of the European close quoting “unnamed” ECB officials as saying QE could begin in January – and stocks immediately rebounded back into the green. The story turned out to be a plant, nothing more than a rehash of Draghi’s earlier statement that “technical preparations” were proceeding apace and could be complete by January. But the story only seemed to reinforce the feeling that QE must be inevitable.
The common analytic theme seems to be that QE European-style may have little impact on the EU economy, partly because the transmission methods are different, partly because the ECB would need to buy a lot of German bunds (already at record centuries-low yields), and partly because, as Nouriel Roubini put it, it would be “too little too late.” Quite possibly, but the stock market is unlikely to care about any of that. These days the lure of central banking QE is growing into the attraction that a new business name once had when it ended with a dot com. You don’t ask questions, you just buy.
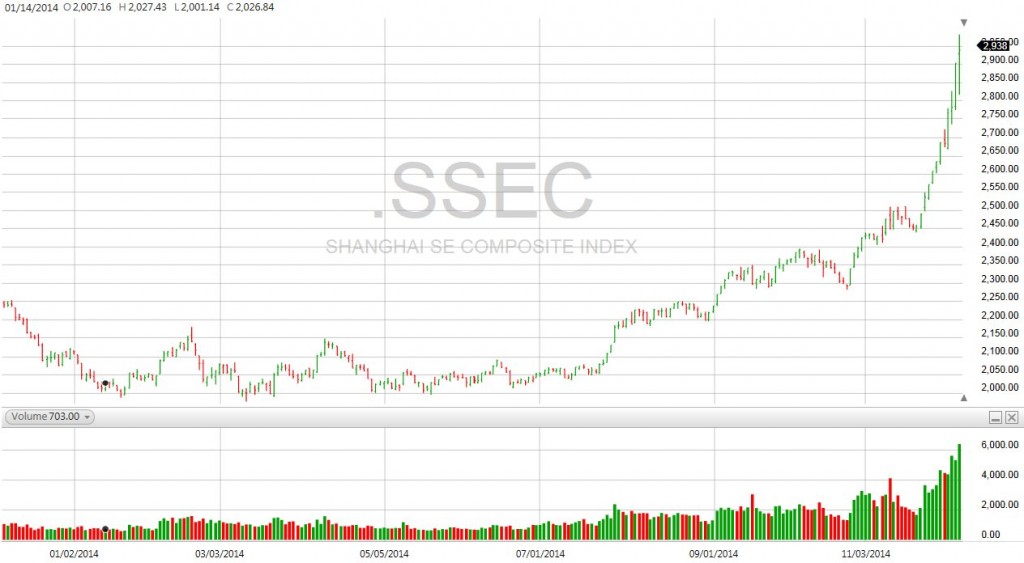
Lest you think I’m exaggerating, it’s exactly what is happening in China. The central bank’s cut in the benchmark lending rate last month has set off a speculative frenzy in the Shanghai stock market:
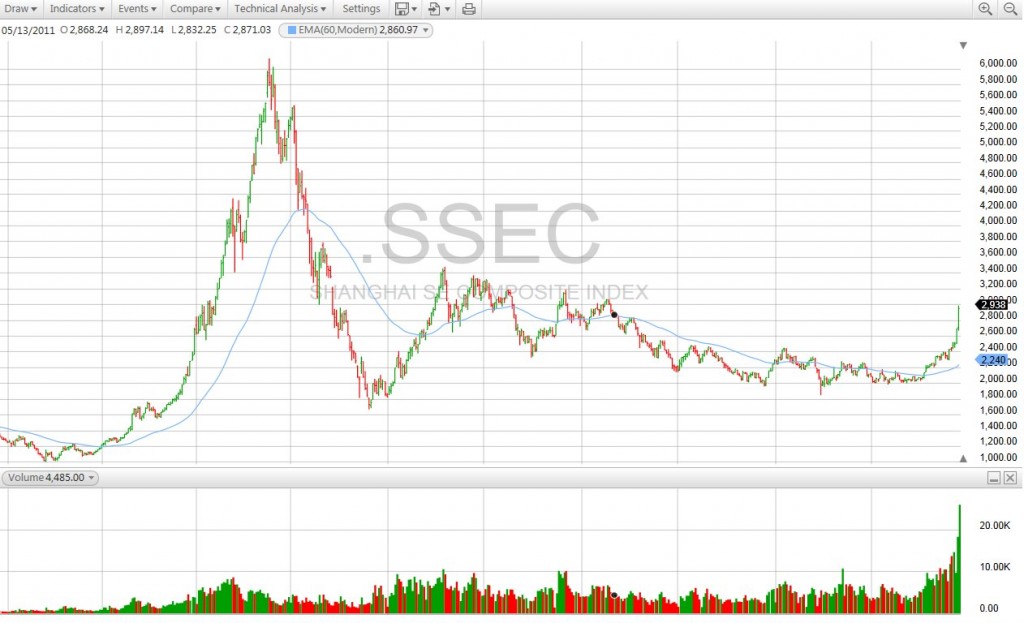
It’s up 50% since May! But if you think that’s bad, the folks at CNBC gleefully warned it could get worse, as evidenced by a ten-year chart showing the 2007 bubble:
Note, however, the much higher volume in the current mania. Indeed, China’s securities regulator felt compelled to issue a warning.
Why is Shanghai’s stock market soaring even as the economy is clearly slowing? Because the economy is clearly slowing, what else? Ergo, say the traders, the government must be preparing big buckets of monetary stimulus, ergo bet on stocks. After all, everything else is going down – property, commodities, wealth accounts – so borrow money (leverage has spiked) and buy away. After all, look what it did for the U.S. market.
But don’t worry folks, there’s no bubble to be seen here, just keep moving along.
The best (or worst) of it is that both markets are quite likely to go higher first. Maybe all the way back to 2000 levels. And every step of the way, 99% of the fund managers and strategists will tell you: “No, no, there is no bubble. It’s not like prices were in 1999.” Until they are.
The Economic Beat
So why wasn’t the impressive-looking jobs report (+321,000) as good as advertised? The first clue comes in the revisions: though the actual count for September and October declined by 13,000, seasonal adjustments added 44,000. That’s quite a boost from factors alone. I thought that the October number (that I had predicted would come in much higher) would get a boost, and it did – to 243,000. I didn’t expect the revision would be on the back of a downward revision to the actual tally.
A second reason comes from comparing the report from a year ago. Last November’s report was quite good too, at 272,000. It had the same one-tenth increase in hours per week. But that trend didn’t go anywhere. Partly the trend ran into the weather, but there is always weather and Novembers seem to run higher in general. Some of this year’s spike may be due to the increase in part-time work and seasonal hiring, some to Obamacare, as the increase in health care and social assistance workers can attest (though total health care costs are growing at the slowest rate since record-keeping began in 1960).
An unhappy comparison is that the growth rate in higher paying jobs, like goods production, was declining, while that of lower-paying jobs (retail trade, health and home care) was increasing. A lot will be made of the 0.4% monthly increase in wages, but the year-on-year total is 2.1%. Last year at this time it was 2.2%. I don’t call that progress. The latest productivity report (completely ignored on Friday) showed unit labor costs decreasing. The growth in retail workers has been explosive this cycle, well ahead of the last one, while goods production has lagged.
The household data is noisy and it’s dangerous to infer too much from one month’s report (that goes for payrolls, too). That said, the household increase of only 4K and the increase in “part-time workers for non-economic reasons” of 235K is tantalizing. The household increase was 683K in October, so the November read may just be balancing the scales, but that part-time report was interesting. While 2014 seems dead set to finally pass the 2007 peak in payroll jobs, the number of people in the insured work force – that is, people who are paying into the social security system – is still at least a couple of quarters away from reaching the last peak in 2008. The monthly report counts jobs, but the insured report counts workers, suggesting a lot of holders of multiple part-time jobs out there.
The unemployment rate (5.8%) did not change, nor did the participation rate. The year-on-year growth in the civilian labor force is an estimated 1.11 million, while that of the “not in labor force” category grew by 1.16 million. The latter category’s consistently faster growth helps to keep the unemployment rate lower. Perhaps it means that there is still bigger job growth in the years ahead, but the rest of the data doesn’t point that way. The U-6 alternative measure of unemployment did inch down to 11.4%. A higher gear for the economy? The U-6 rate was never that high in the last cycle, and five years into the last recovery it stood at 8.4%. It’s not surprising that so many people still think we’re in recession.
Average weekly hours are up one tenth from last month – the same one tenth from a year ago. The weekly hours data series only goes back to 2006 and has been in a very narrow range apart outside of the recession itself. As employment is a lagging indicator and the best performance of the weekly hours metric was in the three quarters that comprise the run up to the recession and the first quarter into it, I’m reluctant to draw much in the way of inferences.
In the end, it’s still nice to see the 321K print (though the ADP report went in the other direction); the year-on-year percentage increases in payrolls are the best (though not as good) since the 1990s. But gains in personal income continue to lag, the recovery has been slower than the last one (which was slower than the one before that) and it’s been seven years since the last peak. Employment gains peak just before the cycle ends, jobs peak after the cycle ends, and I think we are now in the peak of the cycle – with a lot of low-paying jobs to show for it. Saturday’s headline on the Wall Street Journal proclaimed that hiring grew “at the best pace since 1999.” You may recall that the following year was indeed the beginning of a new leg.
The factory orders report for October was in a different world than the employment report, reporting a decrease of 0.7% versus expectations for a loss of 0.3%. The durable goods order the week prior tips off much of the factory orders information, so there usually isn’t much reaction to it. So far, however, the extra inventory build that boosted the third-quarter GDP estimate looks to be on track to come back out of fourth quarter GDP. The first read on the subject comes this Tuesday in the October wholesale inventory report. The October trade report was also worse than expected, and that too will weigh on GDP. Construction spending gained 1.1% and that will help the quarter, though the year-on-year rate continues to fall.
The two ISM survey readings (from November) were both very high and had Wall Street strategists boasting to the skies. That had me grousing, of course. The surveys have correlated poorly with activity this year, but neither the manufacturing survey (58.7) nor the non-manufacturing counterpart (59.3) have ever been reliable leading indicators. They’re coincident indicators, and having now analyzed them intently through the cycle, I’ve concluded that they are more sentiment-based than I once thought. The part that had me grousing was Street so-called economists crowing that these high readings correspond to 5% real growth – a datum that might have been true back in the manufacturing-heavy 1980s, but hasn’t held in decades. It’s flat-out dishonest.
November car sales were good, but looking at personal income along with other retail spending, those car payments may be crowding out other spending. The other retail sales data for November weren’t stellar and are indicating another soft month of spending outside of autos, though the government report has been known to head in different directions. Keep in mind that despite all the fluff in the business media, the decreases in gasoline costs don’t increase the amount of total spending: what comes out of gasoline can go into other categories (though apparel doesn’t seem to be one of them so far), but there is no magic that makes a dollar less in gasoline costs add two dollars to the total. The November report is due next Thursday.
Looking abroad, the economic news in most major economies (EU, Japan, China) continues to weaken, so stock prices are rising on bets of further monetary stimulus. Hardly surprising, but aren’t we getting a bit late in the game for that trade? Even so, I don’t think it will end for some months to come. Trades run until they break.
Back here at home, we’ll get news on inflation this coming week (PPI on Friday), labor turnover (JOLTS) on Tuesday and a slew of Chinese data throughout the week, the most important (though not necessarily the most accurate) being industrial production and retail sales on Friday.
