Get 40% Off
👀 👁 🧿 All eyes on Biogen, up +4,56% after posting earnings. Our AI picked it in March 2024.
Which stocks will surge next?
Unlock AI-picked Stocks

The Long Tail Of Deflation

Published 04/22/2014, 02:12 AM
Updated 07/09/2023, 06:31 AM

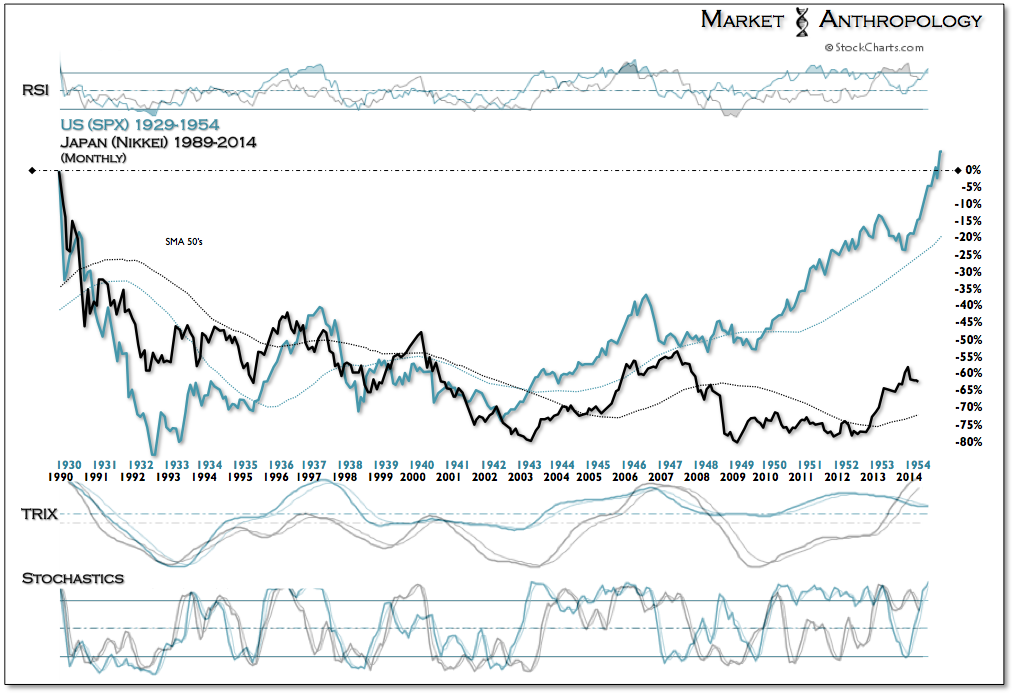
It took the Dow Jones Industrial Average and the S&P 500 basically twenty five years (give or take a month) to recapture the nominal 1929 secular highs. With Japan's Nikkei now trading well into its twenty fourth year since its secular peak in 1989, we thought we would take a quick comparative look at the two most cited deflationary spirals (as weighed by their respective equity market performances) and contrast them with the most recent European deflationary trend as expressed by Spain's IBEX index. 
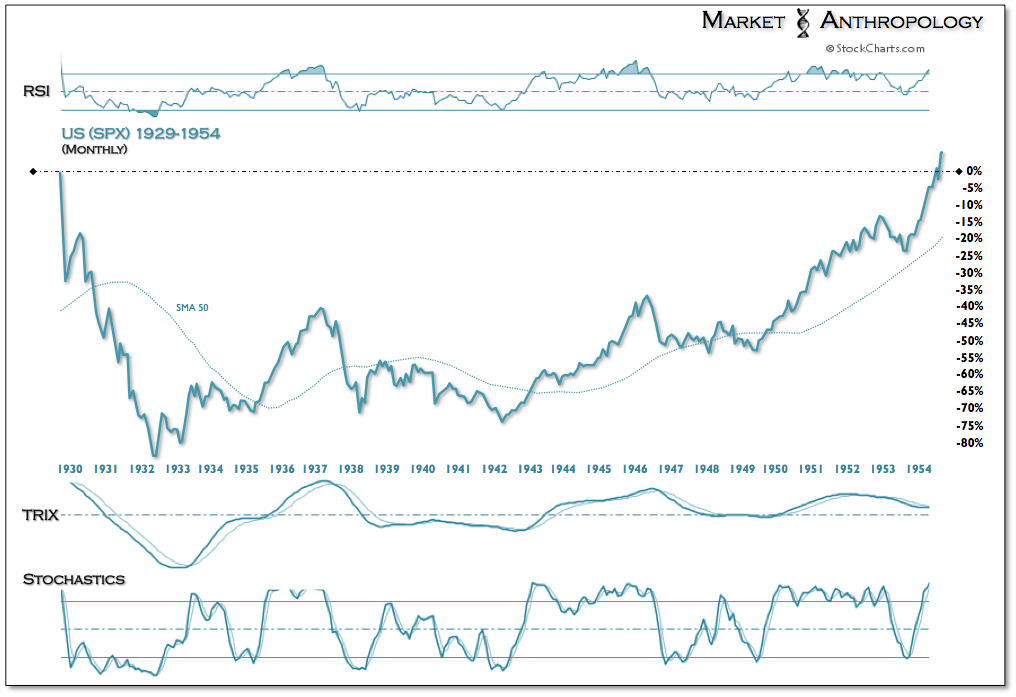
SPX Monthly 1929-1954Both the SPX and the Nikkei contracted ~ 80% below their secular peaks. In the US, the equity market collapse was acute and reached a secular low less than three years from the 1929 high. For Japan, the contraction was more prolonged and eroding - reaching a secular low ~20 years from its 1989 high.
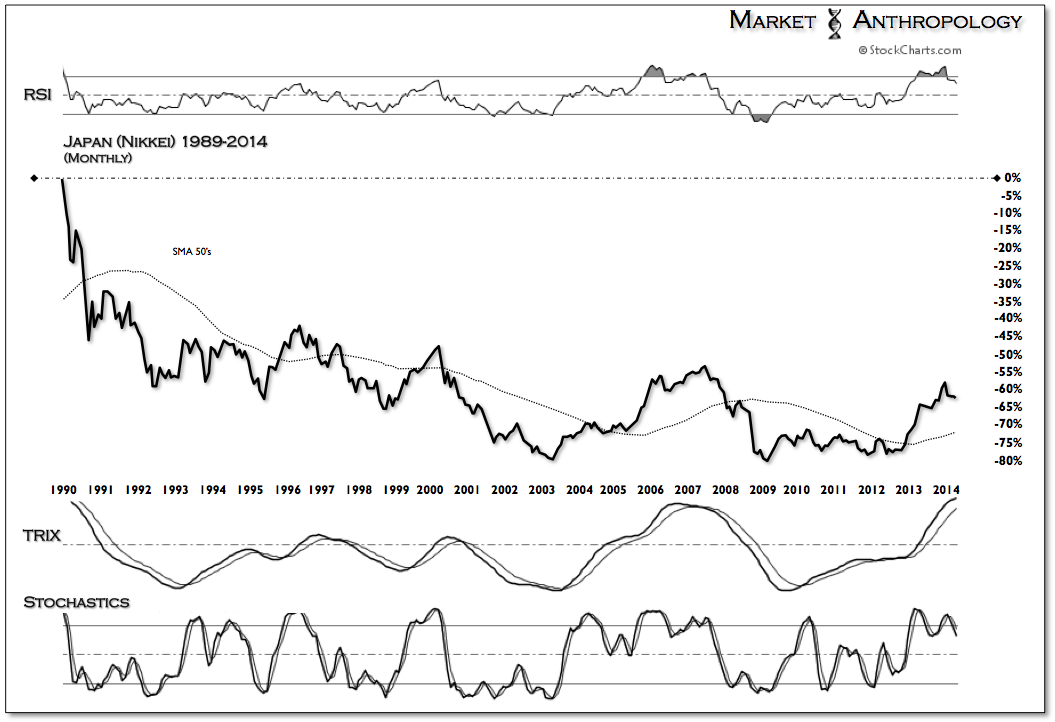
Nikkei Monthly, 1989-2014
The massive bounce (+300%) in the SPX extending from the 1932 low up to the cyclical high in 1937 "normalized" the two performance trends through the back half of the first decade (post peak). Over the next 10 years the SPX firmed and diverged from Japan's prolonged performance slump that many financial historians believe resulted from the US joining the Allied Powers in WWII at the end of 1941 as a result, hastening the underlying deflationary conditions at home. The comparative performance profiles diverged even further with the most recent financial crisis that swept the globe in 2008/2009 and maintained pressures on Japan's pernicious bout with deflation. 
SPX 1929-1954 vs Nikkei 1989-2014
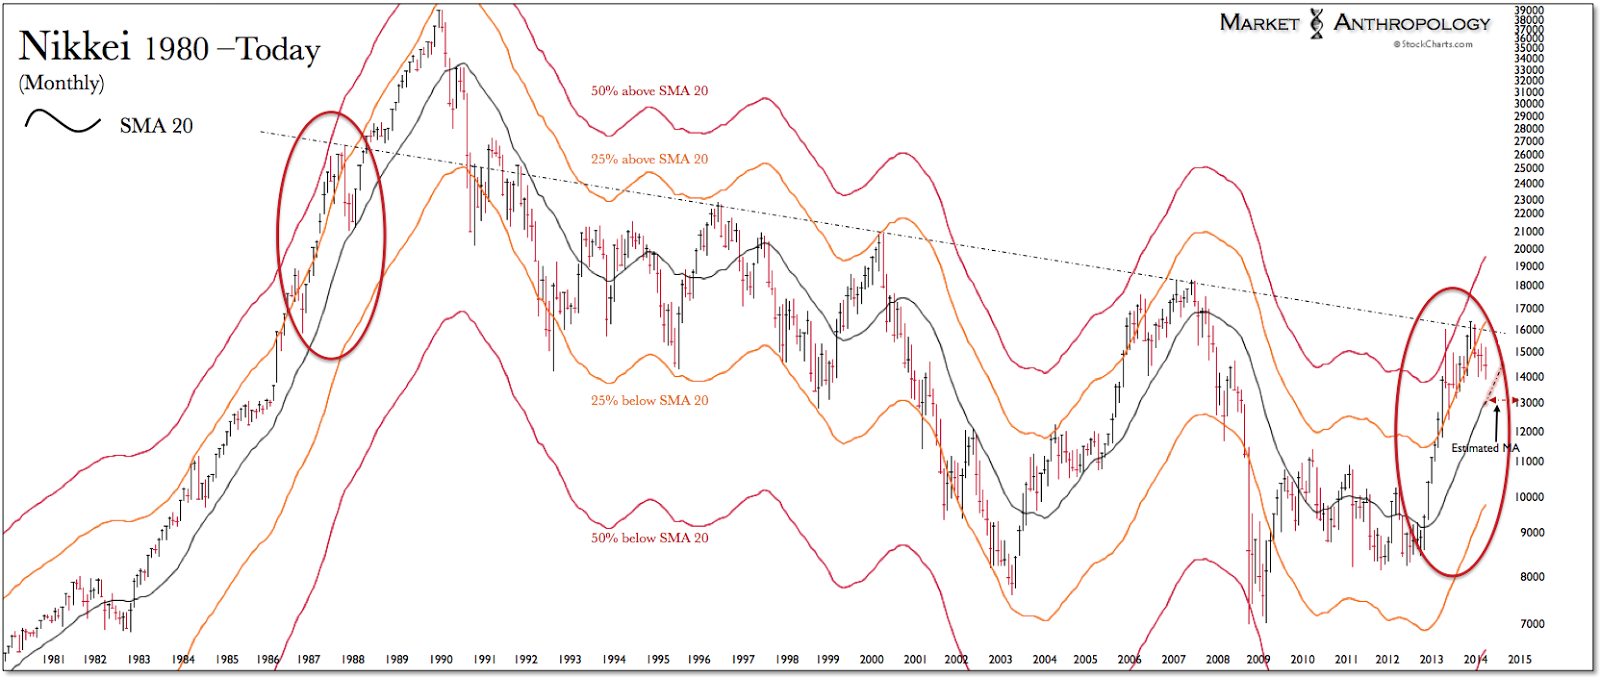
Our general outlook for the Nikkei this year has been that the rally that began with the commencement of Abenomics at the end of 2012 became stretched to a relative extreme and that the breakout leg for Japan and perhaps its perennial battle with deflation would occur at a lower level (technically) and after another subsequent correction. That correction has materialized this year with the Nikkei underperforming almost every major market in 2014.  
3rd party Ad. Not an offer or recommendation by Investing.com. See disclosure here or remove ads .

Nikkei 1980-Today
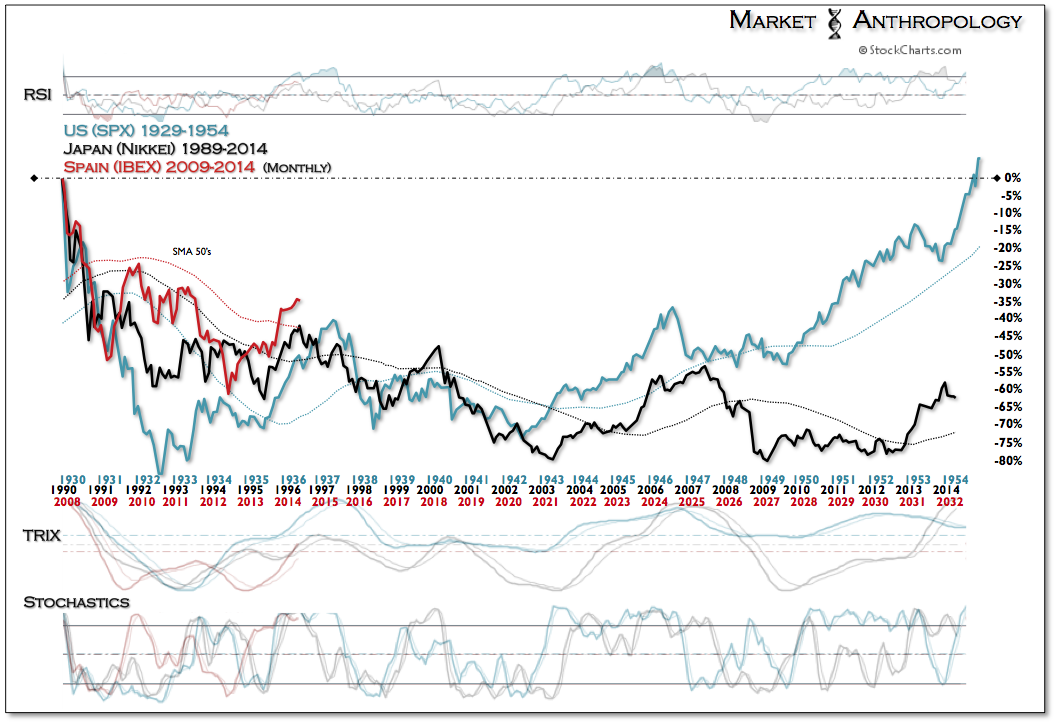
While the Nikkei has come under pressure in its twenty fourth year since making a secular high at the end of 1989, Spain's IBEX has trended higher, albeit traversing between positive and negative for the year on several occasions. It has essentially trended with the SPX but with a higher beta return. Our longer-term expectations this year have progressively become more bearish as the structure of both indexes have shifted from a flagging and consolidating pattern to what we suspect could become a cyclical top for both markets. With that said, we are far more bearish on the long-term prospects for Spain and the IBEX and see great similarities - both from an economic and market perspective, to Japan over the last quarter century. 

Although it is likely too early to put on both sides of the trade, an alluring pairs trade (long Japan/short Spain) between these two deflationary cousins may have considerable open road to run as one market transitions out of deflation as the other cycles back in.      
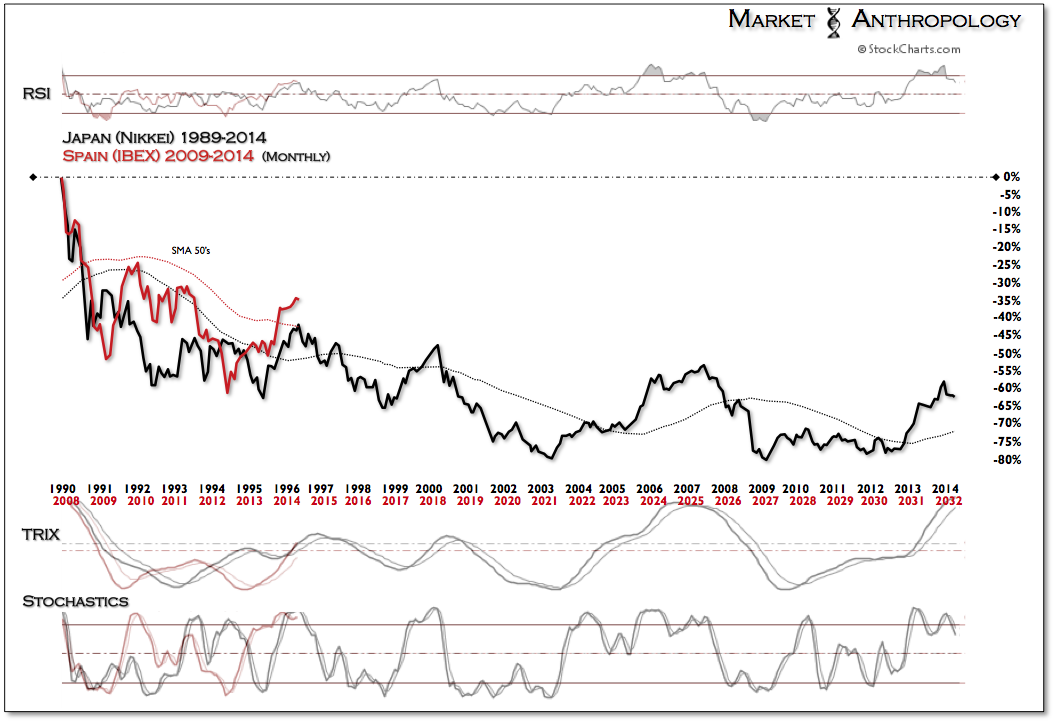
Nikkei 1989-2014 vs. Ibex 2009-2014 Monthly
SPX 1929-1954 vs Nikke 1989-2014 vs Ibex 2009-2014

Latest comments

Risk Disclosure: Trading in financial instruments and/or cryptocurrencies involves high risks including the risk of losing some, or all, of your investment amount, and may not be suitable for all investors. Prices of cryptocurrencies are extremely volatile and may be affected by external factors such as financial, regulatory or political events. Trading on margin increases the financial risks.
Before deciding to trade in financial instrument or cryptocurrencies you should be fully informed of the risks and costs associated with trading the financial markets, carefully consider your investment objectives, level of experience, and risk appetite, and seek professional advice where needed.
Fusion Media would like to remind you that the data contained in this website is not necessarily real-time nor accurate. The data and prices on the website are not necessarily provided by any market or exchange, but may be provided by market makers, and so prices may not be accurate and may differ from the actual price at any given market, meaning prices are indicative and not appropriate for trading purposes. Fusion Media and any provider of the data contained in this website will not accept liability for any loss or damage as a result of your trading, or your reliance on the information contained within this website.
It is prohibited to use, store, reproduce, display, modify, transmit or distribute the data contained in this website without the explicit prior written permission of Fusion Media and/or the data provider. All intellectual property rights are reserved by the providers and/or the exchange providing the data contained in this website.
Fusion Media may be compensated by the advertisers that appear on the website, based on your interaction with the advertisements or advertisers.
© 2007-2024 - Fusion Media Limited. All Rights Reserved.