The weekend focus has generally been one of a political nature, with traders, perhaps predictably, gaining confirmation that Angela Merkel will run for chancellor in the German elections in 2017. Many are also looking to see the results of the first Conservative primary vote in France, and while there will a second round of voting next weekend the victor (of Sarkozy, Juppe or Fillon) will face Marine Le Pen in the 7 May presidential election.
Asia-based traders have also been brushing up on their knowledge of the Italian referendum (4 December) on constitutional reform in the Italian Senate. The base case remains that this referendum will be voted down and Matteo Renzi will likely step down as prime minister and we will face new elections, which will only heighten the political uncertainty. There are trading opportunities already firmly in the markets foresights here, with the Italian MIB falling 3.3% last week (-5.5% in USD terms), relative to the DAX which was unchanged on the week and the S&P 500 which was up 3.2% in EUR terms.
We have also seen the political risk showing up front and centre in the bond market, with the Italian 10-year BTP commanding a 182 basis point premium over the benchmark German bund. Expect this referendum to get even greater focus in the next couple of weeks, especially if the MIB breaks 16,000 as the index is going lower – one for the radar, as a break of 16,000 and we should see a fairly quick move into 15,000.
The financial markets still have the bond market right at the epi-centre of almost everything right now and rightly so, the moves have been incredible. The fixed income market is clearly driving EUR/USD and USD/JPY and ultimately pushing the trade-weighted USD to a new 14-year high. Whether it’s the US 10-year Treasury widening to the highest level in 27 years over the German bund, or the premium over Japanese government bonds now the greatest levels since April 2010, the extra yield one can achieve (to maturity) in the US largely thanks to ‘Trumponomics’ makes the USD just so attractive.
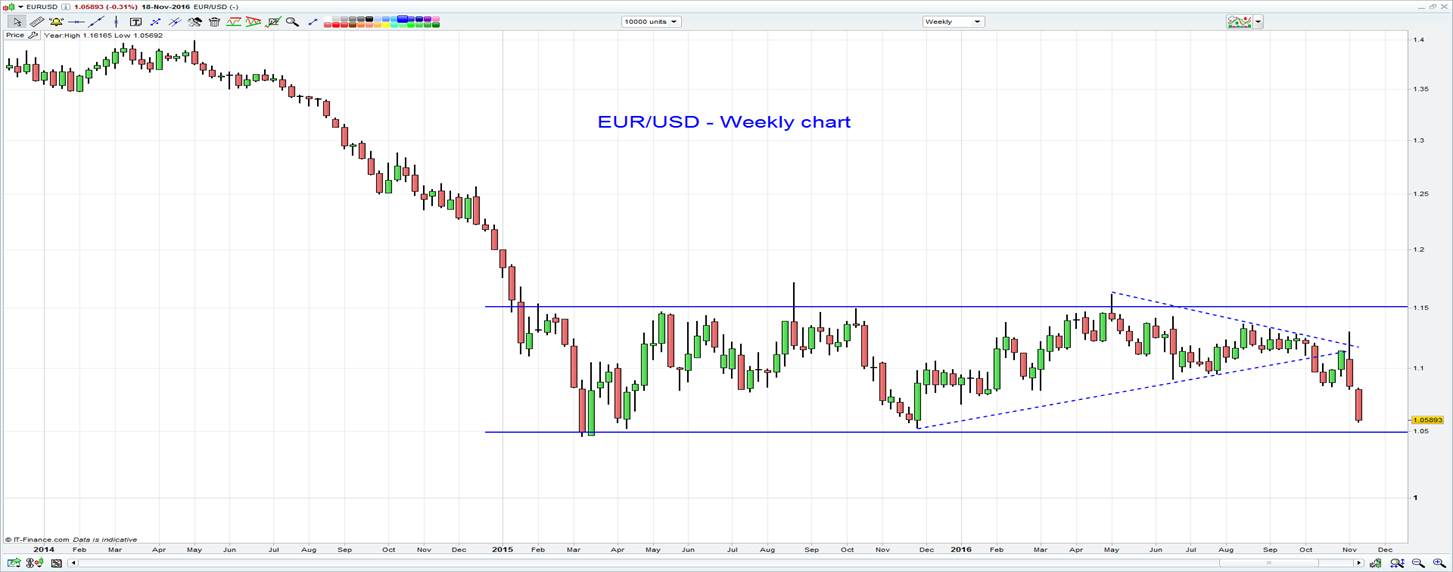
While we have seen the US dollar index rally for 10 consecutive days, given this ballooning yield differential expect pullbacks to minimal. Take a look at the weekly chart of EUR/USD, the pair is now eyeing the bottom of the $1.1500 to $1.0500, so this has to be on everyone’s radar as the price action is about as bearish as one would ever see and whether this is just a reflection of a widening yield differential or traders are hedging the Italian referendum risk through shorting EUR’s is unclear. One suspects it’s a combination of both thematics. Either way, if we see a break of $1.0500 in the weeks ahead then one suspect’s parity is on the cards in Q1 17.

We can firmly see the USD strength front and centre in AUD/USD, although AUD/CAD was the big loser last week falling 3.2%. I still expect AUD/CAD to trade lower, especially into the 30 November OPEC meeting and despite a sizeable increase of 19 rigs in the US Baker-Hughes oil rig count last week (to 471 rigs) increasing the supply dynamic, the market is far more concerned with the ability of the cartel to muster an agreement on production freezes. Comments from the Iranian Oil Minister over the weekend suggests this is possible.
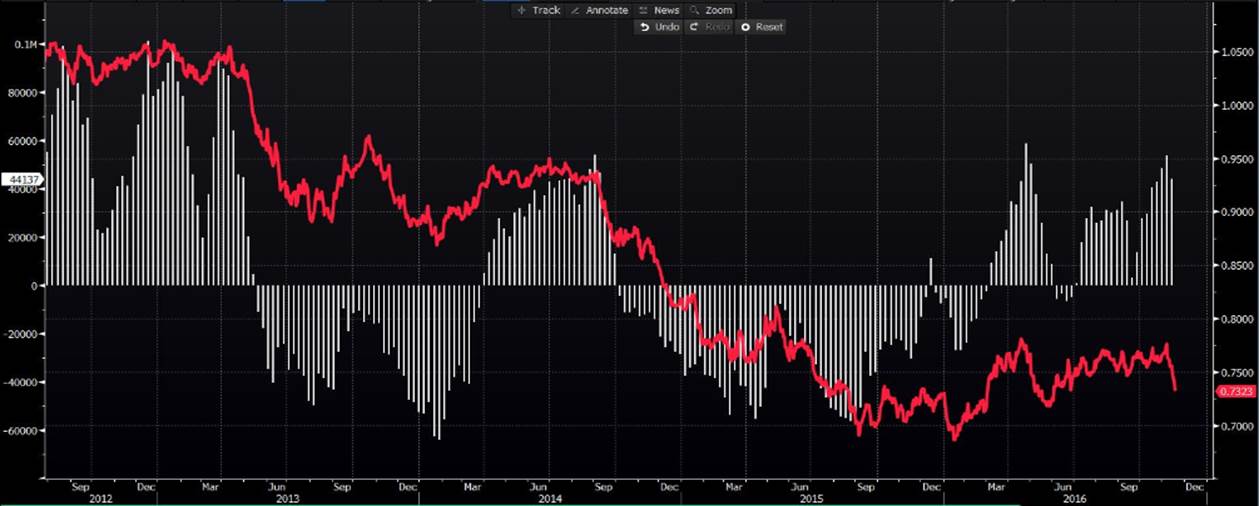
I suspect the key to downside in AUD/USD though has been a rampant position adjustment from leveraged funds. As of Tuesday (when the data was last recorded), we can see that speculative funds were still running a fairly sizeable net long position of 44,137 futures contracts (as measured in the weekly ‘commitment of traders report’ – see Bloomberg chart below).
Given the data was recorded on Tuesday (and reported to the market on Saturday morning) I would say there has been an almighty unwind of long positions, largely driven by a collapse in bulk commodities, concerns around emerging markets (thanks to the broad USD strength) and a breakdown in the techincals that suggests we could be seeing AUD/USD test the May lows of $0.7150 sooner than many had anticipated. The only question one should be asking here is ‘do I sell at market or do I wait for retracement?’ Bear in mind that retracements have been minimal at best.

Turning to equities, and while FX, commodity and fixed income markets are seeing great volatility we expect a fairly sanguine open this morning. The ASX 200 was largely unchanged on the week and the fact SPI futures closed Friday’s overnight session up seven points suggests a calm open for all sectors. BHP and CBA’s ADR are very modestly higher. However, with iron ore, coking coal and steel futures falling 4.6%, 3.1% and 4.2% respectively on Friday night perhaps there could be downside to the BHP call.
