“In the middle of every difficulty lies an opportunity.”
-Albert Einstein
It was a painful week for bullish investors in the stock market as evidenced by the -1,018 point drop in the Dow Jones Industrial Average, equivalent to approximately a -6% decline. The S&P 500 index did not fare any better and the loss for the tech-heavy NASDAQ index was down closer to -7% for the week.
The media is attributing much of the short-term weakness to a triple Chinese whammy of factors:
- Currency devaluation of the yuan.
- Weaker Chinese manufacturing data registering in at the lowest level in over six years.
- A collapsing Chinese stock market.
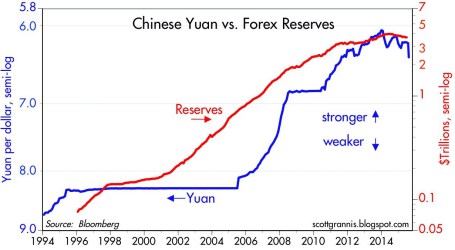
As the second largest economy on the planet, developments in China should not be ignored, however these dynamics should be put in the proper context. With respect to China’s currency devaluation, Scott Grannis at Calafia Beach Pundit puts the foreign exchange developments in proper perspective. If you consider the devaluation of the yuan by -4%, this change only reverses a small fraction of the Chinese currency appreciation that has taken place over the last decade (see chart below). Grannis rightfully points out the -25% collapse in the value of the euro relative to the U.S. dollar is much more significant than the minor move in the yuan. Moreover, although the move by the People’s Bank of China (PBOC) makes America’s exports to China less cost competitive, this move by Chinese bankers is designed to address exactly what investors are majorly concern about — slowing growth in Asia.
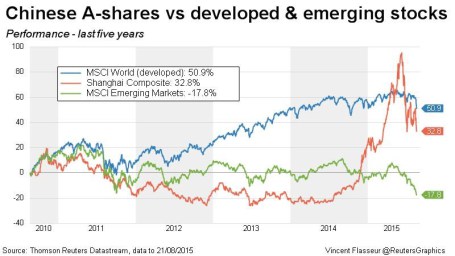
Although the weak Chinese manufacturing data is disconcerting, this data is nothing new — the same manufacturing data has been very choppy over the last four years. On the last China issue relating to its stock market, investors should be reminded that despite the massive decline in the Shanghai Composite, the index is still up by more than +50% versus a year ago (see chart below).
Fear the Falling Knife?
Given the fresh carnage in the U.S. and foreign markets, is now the time for investors to attempt to catch a falling knife? Catching knives for a living can be a dangerous profession, and many investors — professionals and amateurs alike — have lost financial fingers and blood by attempting to prematurely purchase plummeting securities. Rather than trying to time the market, which is nearly impossible to do consistently, it’s more important to have a disciplined, unemotional investing framework in place.
Hall of Fame investor Peter Lynch sarcastically highlighted the difficulty in timing the market, “I can’t recall ever once having seen the name of a market timer on Forbes‘ annual list of the richest people in the world. If it were truly possible to predict corrections, you’d think somebody would have made billions by doing it.”
I am a bottom-up investor when it comes to individual security selection. Driving my global views are the following four factors: profits, interest rates, sentiment and valuations. Currently, two of the four indicators are flashing green (interestrates and sentiment), and the other two are neutral (profits and valuations).
- Profits (Neutral): Profits are at record highs, but a strong dollar, weak energy sector, and sluggish growth internationally have slowed the trajectory of earnings.
- Valuation (Neutral): At an overall P/E of about 18x’s profits for the S&P 500, current valuations are near historical averages. For CAPE investors who have missed the tripling in stock prices, you can reference prior discussions. I could make the case that stocks are very attractive with a 6% earnings yield (inverse P/E ratio) compared to a 2% 10-Year Treasury bond, but I’ll take off my rose-colored glasses.
- Interest Rates (Positive): Rates are at unambiguously low levels, which, all else equal, is a clear-cut positive for all cash generating asset classes, including stocks. With an unmistakably dovish Federal Reserve in place, whether the 0.25% interest rate hike comes next month or next year will have little bearing on the current shape of the yield curve. Chairman Yellen has made it clear the trajectory of rate increases will be very gradual, so it will take a major shift in economic trends to move this factor into neutral or negative territory.
- Sentiment (Positive): Following the investment herd can be very dangerous for your financial health. We saw that in spades during the late-1990s in the technology industry and also during the mid-2000s in the housing sector. As Warren Buffett says, it is best to “buy fear and sell greed” — last week we saw a lot of fear.
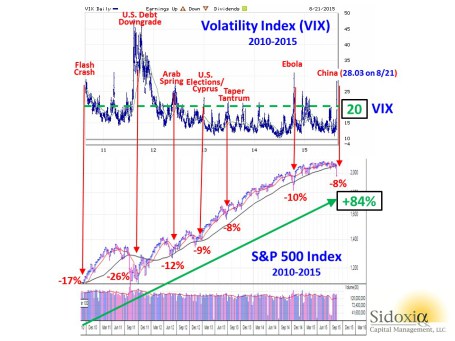
In addition to the immense outflows out of stock funds, panic was clearly evident in the market last week as shown by the volatility index (VIX), AKA, the “Fear Gauge.” In general, volatility over the last five years has been on a declining trend, however every 6-12 months, some macro concern inevitably rears its ugly head and volatility spikes higher. With the VIX exploding higher by an amazing +118% last week to a level of 28.03, it is proof positive how quickly sentiment can change in the stock market.
Not much in the investing world works exactly like science, but buying stocks during previous fear spikes, when the VIX level exceeds 20, has been a very lucrative strategy. As you can see from the chart below, there have been numerous occasions over the last five years when the over-20 level has been breached, which has coincided with temporary stock declines in the range of -8% to -26%. However, had you held onto stocks, without adding to them, you would have earned an +84% return (excluding dividends) in the S&P 500 index. Absent the 2011 period, when investors were simultaneously digesting a debt downgrade, deep European recession and domestic political fireworks surrounding a debt ceiling, these periods of elevated volatility have been relatively short-lived.
Chart sources include Investors.com and MarketWatch.
Whether this will be the absolute best time to buy stocks is tough to say. Stocks are falling like knives, and in many instances prices have been sliced by more than -10%, -20%, or -30%. It’s time to compile your shopping list because valuations in many areas are becoming more compelling and eventually gravity will run its full course. That’s when your strategy needs to shift from avoiding the falling knives to finding the bouncing tennis balls. Excuse me while I grab my racket.
Disclosure: Sidoxia Capital Management (SCM) and some of its clients hold positions in certain exchange traded funds (ETFs) including emerging market/Chinese ETFs, but at the time of publishing, SCM had no direct position in any other security referenced in this article. No information accessed through the Investing Caffeine (IC) website constitutes investment, financial, legal, tax or other advice nor is to be relied on in making an investment or other decision.
- English (UK)
- English (India)
- English (Canada)
- English (Australia)
- English (South Africa)
- English (Philippines)
- English (Nigeria)
- Deutsch
- Español (España)
- Español (México)
- Français
- Italiano
- Nederlands
- Português (Portugal)
- Polski
- Português (Brasil)
- Русский
- Türkçe
- العربية
- Ελληνικά
- Svenska
- Suomi
- עברית
- 日本語
- 한국어
- 简体中文
- 繁體中文
- Bahasa Indonesia
- Bahasa Melayu
- ไทย
- Tiếng Việt
- हिंदी
The Art Of Catching Falling Knives: Investing In A Volatile Market
Published 08/23/2015, 03:03 AM
Updated 07/09/2023, 06:31 AM
The Art Of Catching Falling Knives: Investing In A Volatile Market
3rd party Ad. Not an offer or recommendation by Investing.com. See disclosure here or
remove ads
.
Latest comments
Install Our App
Risk Disclosure: Trading in financial instruments and/or cryptocurrencies involves high risks including the risk of losing some, or all, of your investment amount, and may not be suitable for all investors. Prices of cryptocurrencies are extremely volatile and may be affected by external factors such as financial, regulatory or political events. Trading on margin increases the financial risks.
Before deciding to trade in financial instrument or cryptocurrencies you should be fully informed of the risks and costs associated with trading the financial markets, carefully consider your investment objectives, level of experience, and risk appetite, and seek professional advice where needed.
Fusion Media would like to remind you that the data contained in this website is not necessarily real-time nor accurate. The data and prices on the website are not necessarily provided by any market or exchange, but may be provided by market makers, and so prices may not be accurate and may differ from the actual price at any given market, meaning prices are indicative and not appropriate for trading purposes. Fusion Media and any provider of the data contained in this website will not accept liability for any loss or damage as a result of your trading, or your reliance on the information contained within this website.
It is prohibited to use, store, reproduce, display, modify, transmit or distribute the data contained in this website without the explicit prior written permission of Fusion Media and/or the data provider. All intellectual property rights are reserved by the providers and/or the exchange providing the data contained in this website.
Fusion Media may be compensated by the advertisers that appear on the website, based on your interaction with the advertisements or advertisers.
© 2007-2024 - Fusion Media Limited. All Rights Reserved.


