Upcoming US Events for Today:- Chain Store Sales for June will be released throughout the day.
- Weekly Jobless Claims will be released at 8:30am. The market expects Initial Claims to show 315K, consistent with the previous report.
- Wholesale Trade for May will be released at 10:00am. The market expects a month-over-month increase of 0.6% versus an increase of 1.1% previous.
Upcoming International Events for Today:
- China Merchandise for June will be released. The market expects $35.0B versus $35.92B previous. Exports are expected to show a year-over-year increase of 9.9% versus an increase of 7.0% previous. Imports are expected to show an increase of 7.9% versus a decline of 1.6% previous.
- ECB publishes its monthly report at 4:00am EST.
- Great Britain Merchandise Trade for May will be released at 4:30am EST. The market expects a deficit of £8750M versus a deficit of £9624M previous.
- Bank of England announcement will be released at 7:00am EST. The market expects no change in rates at 0.50%.
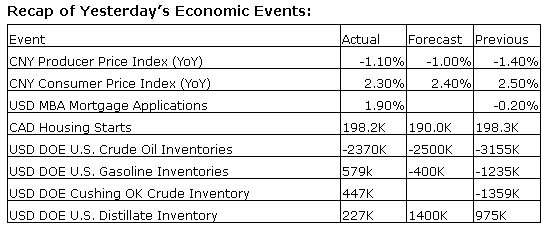
The Markets
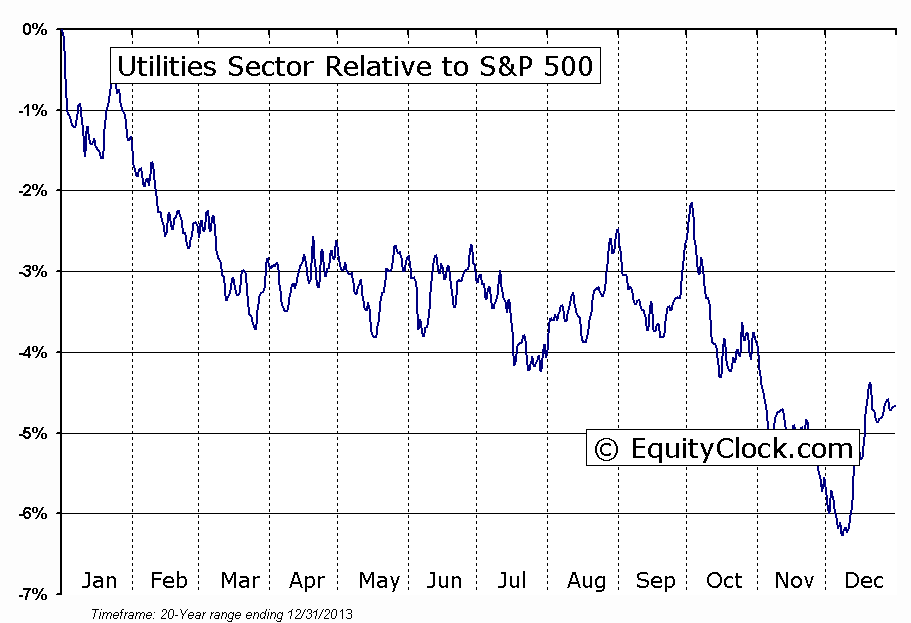
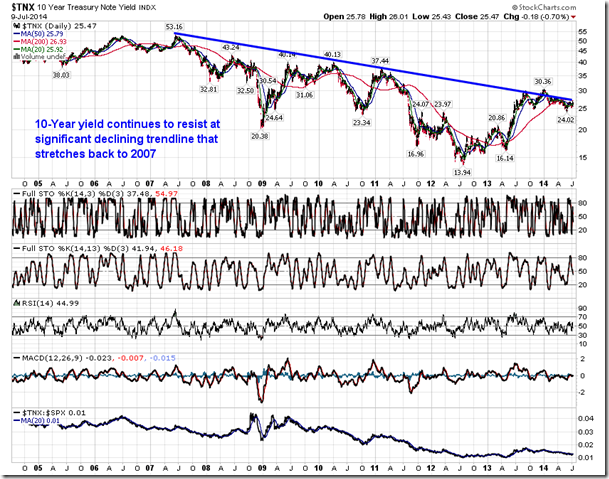
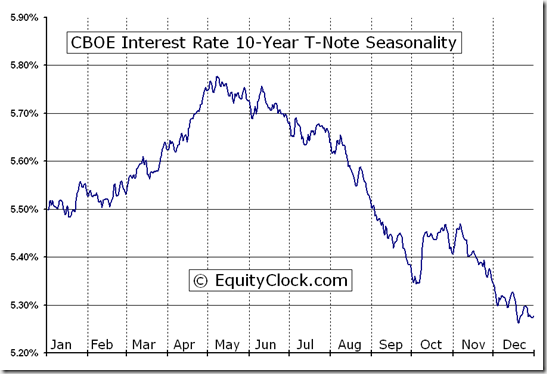
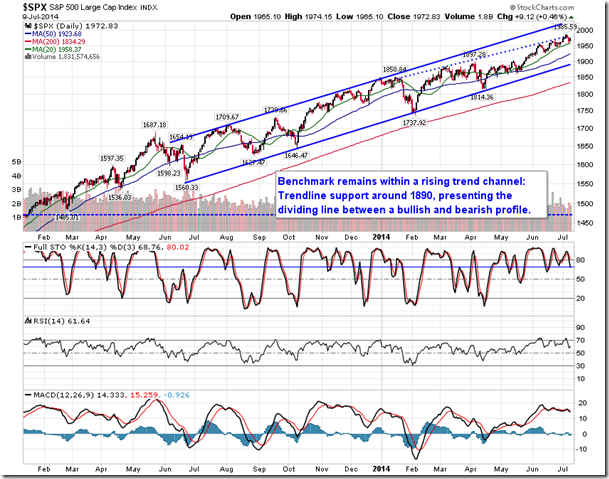
Stocks ended higher on Wednesday following minutes from the latest FOMC meeting indicating that the Fed is committed to concluding its bond buying program by October. The statement provided investors with a certain degree of confidence that the economy is able stand on its own two feet without the ongoing support from the fed via asset purchases. Major equity benchmarks in the US, including the S&P 500 Index, Dow Jones Industrial Average, and NASDAQ Composite, bounced from their rising 20-day moving average lines, attempting to recoup some of the losses recorded during the first two days of the week. Consumer Discretionary stocks topped the leaderboard during the session while Utilities continued to trade inverse to the market direction, declining as the broad market moved higher. The Utilities sector is approaching its period of seasonal strength, which runs from the middle of July through to the start of October, however, investor indecision on the direction of interest rates may impact the trade over the months ahead. Utility stocks typically move higher as rates move lower, a seasonal norm during the summer months. The 10-year treasury yield continues to bump up against long-term trendline resistance, the breakout of which would negatively pressure interest-rate sensitive stocks that typically perform well in the summer, such as utilities and REITs. For now, the intermediate and long-term trend for rates remains negative, but the end of the Fed’s bond buying program combined with a rotation from bonds to stocks could fuel an abrupt shift in trend. Treasury yields seasonally trend lower through to October.
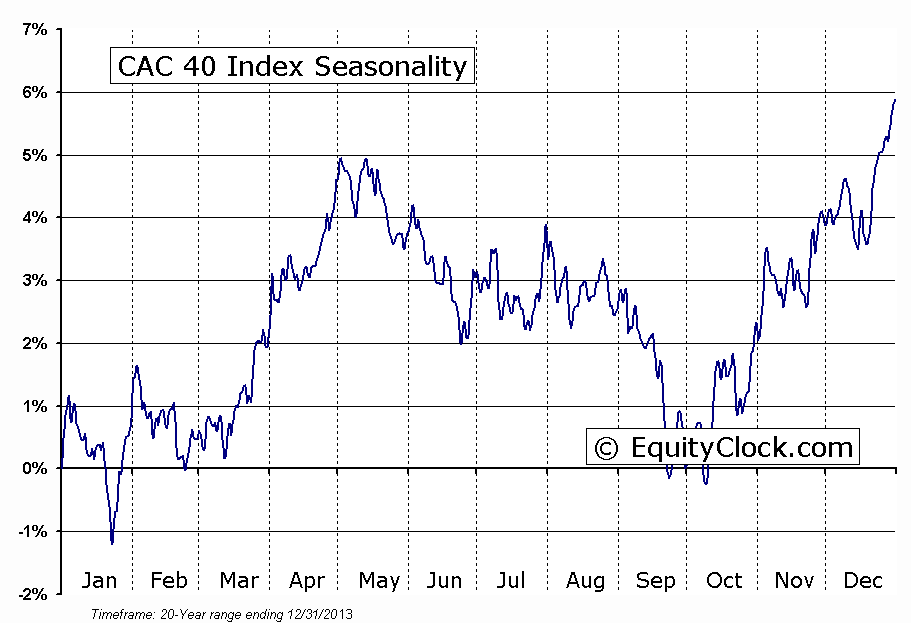
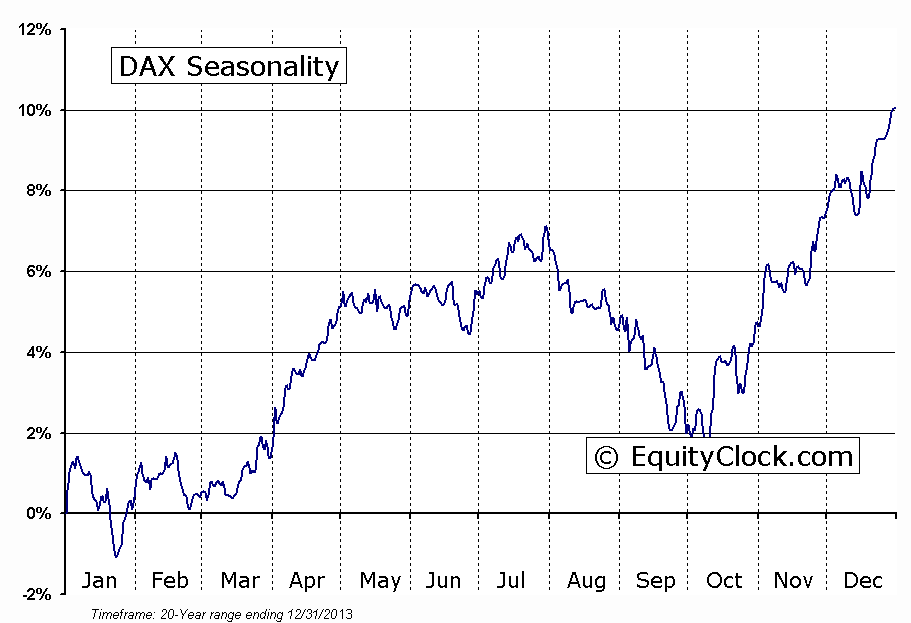
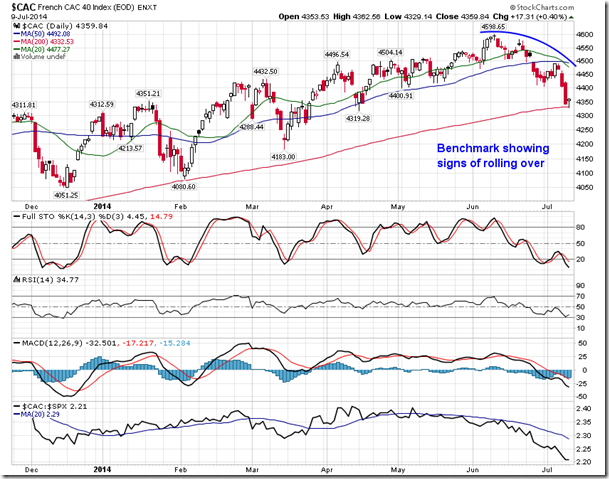
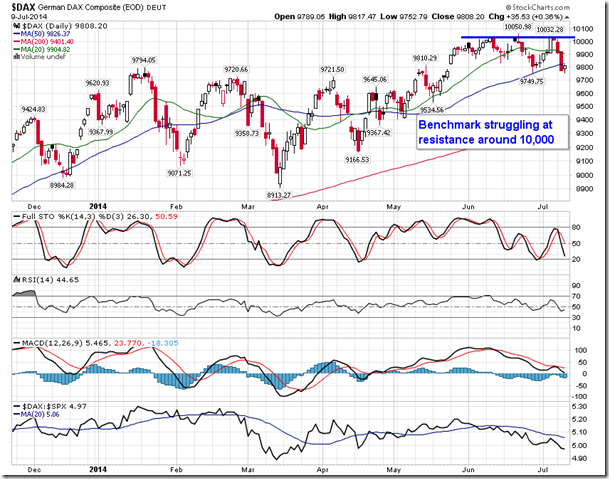
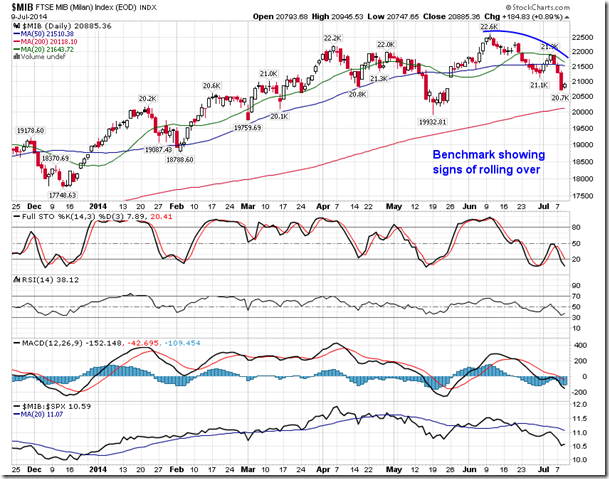
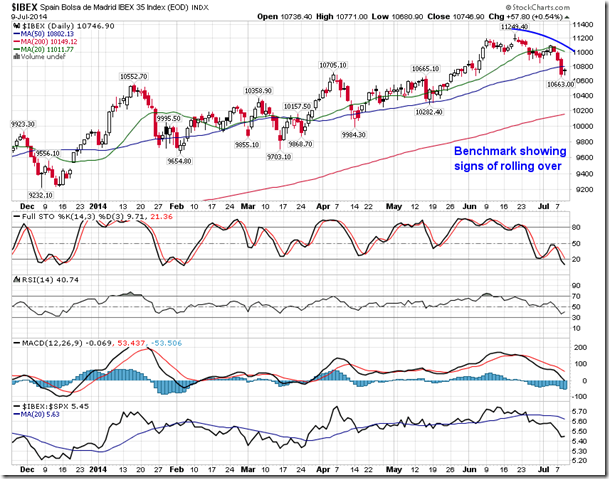
Jumping to stocks on the other side of the ocean, equity benchmarks in Europe are showing signs of rolling over. The DAX, CAC, FTSE MIB, and IBEX have each broken below their respective 50-day moving average lines as a rising Euro pressures stocks in the region lower; underperformance of European benchmarks versus American counterparts has been apparent for the past month. European equity benchmarks are entering a period of seasonal weakness that runs from July through to October; the DAX and CAC have averaged declines of 4% to 5% over the past 20 years, trading to a seasonal low in October, ahead of the period of seasonal strength for equity markets around the globe. Seasonal trends amongst benchmarks in Europe tend to be more pronounced than in the US, recording larger gains and losses during the various seasonal trends throughout the year. Continued weakness in European equities could weigh on stocks in the US given the high correlation amongst stocks between the two continents.
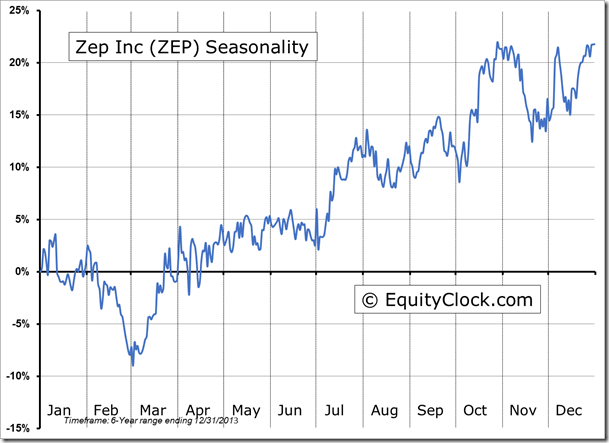
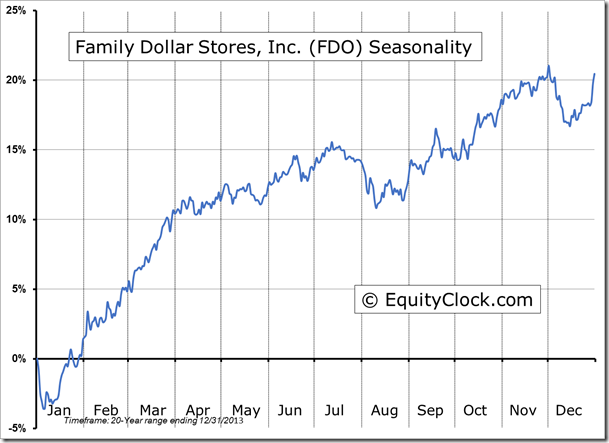
Seasonal charts of companies reporting earnings today:
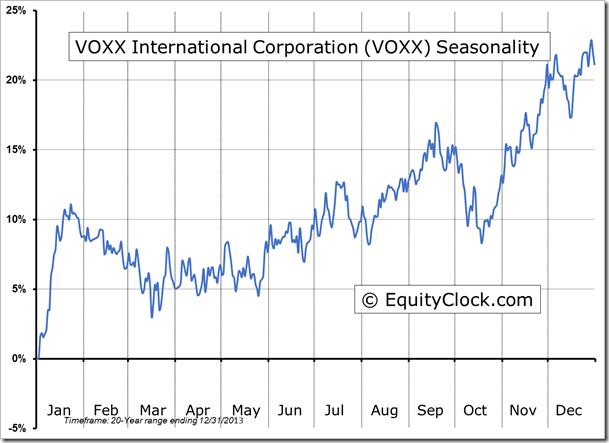
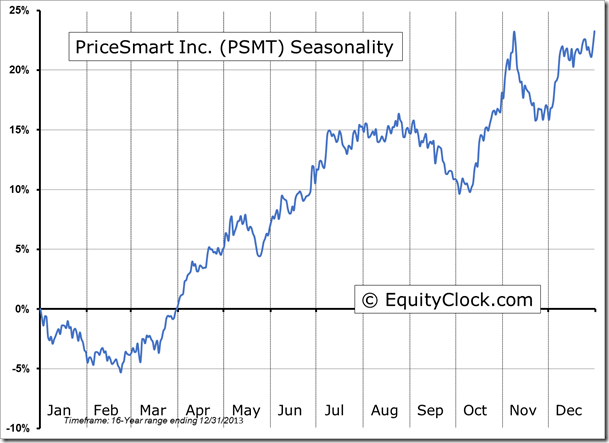
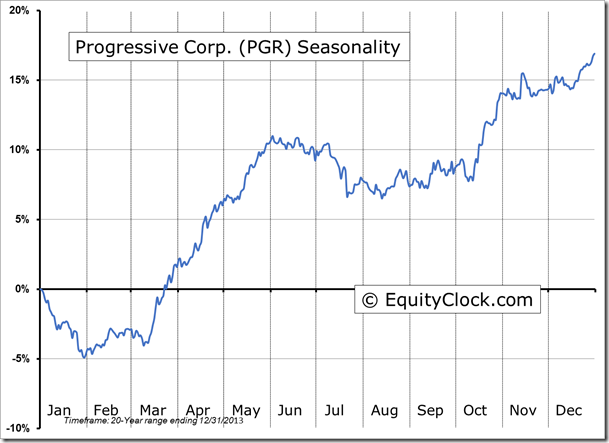
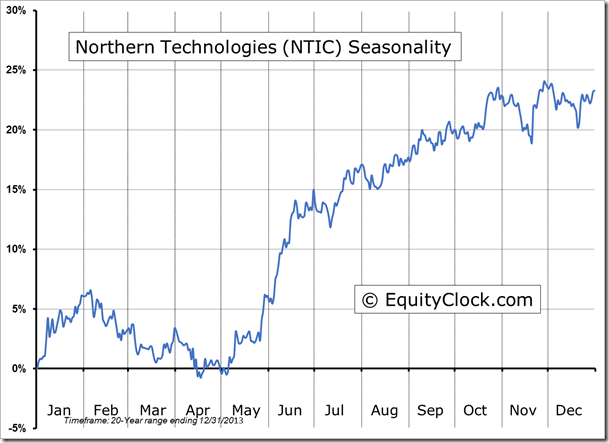
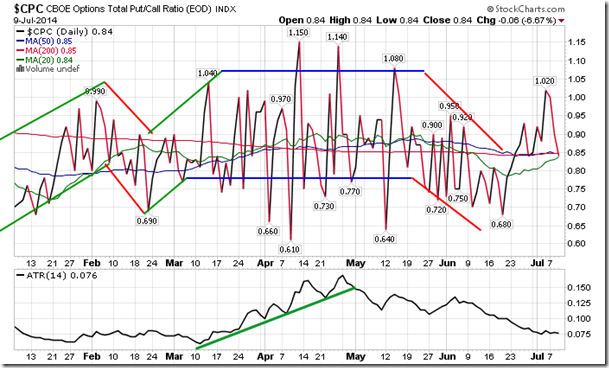
Sentiment on Wednesday, as gauged by the put-call ratio, ended bullish at 0.84.
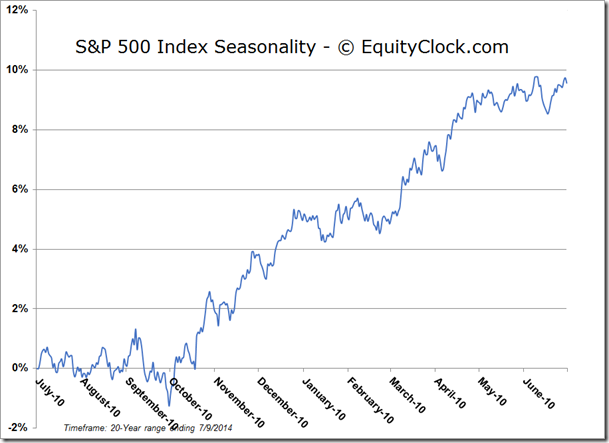
S&P 500 Index
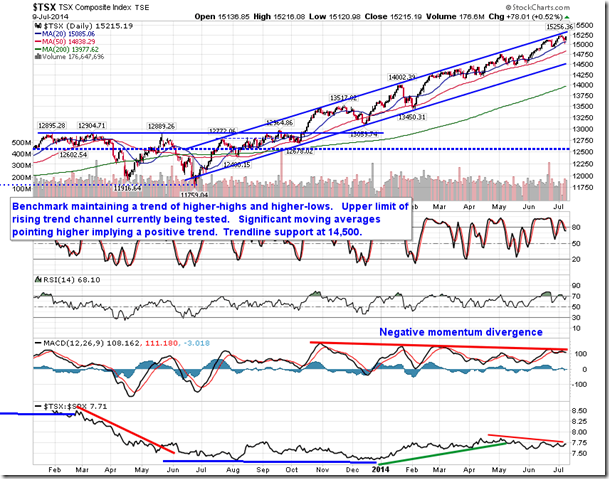
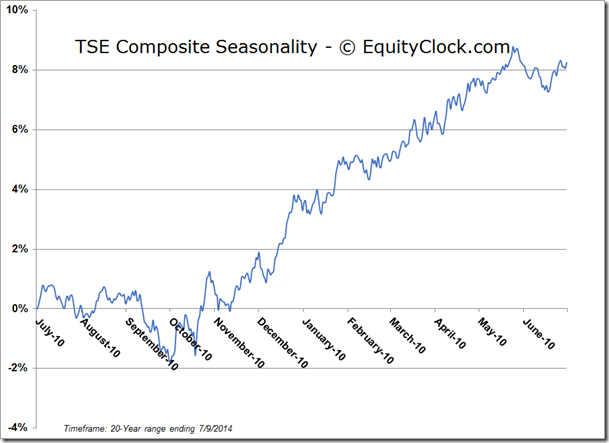
TSE Composite
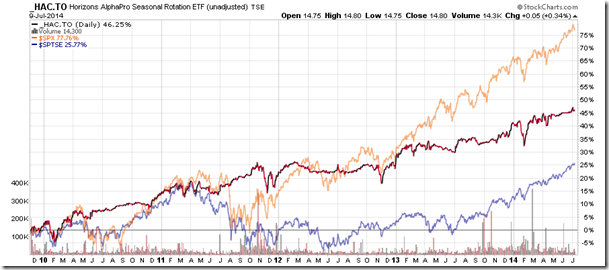
Horizons Seasonal Rotation ETF (TSX:HAC)
- Closing Market Value: $14.80 (up 0.34%)
- Closing NAV/Unit: $14.80 (up 0.37%)
Performance*
| 2014 Year-to-Date | Since Inception (Nov 19, 2009) | |
| HAC.TO | 3.50% | 48.0% |
* performance calculated on Closing NAV/Unit as provided by custodian
