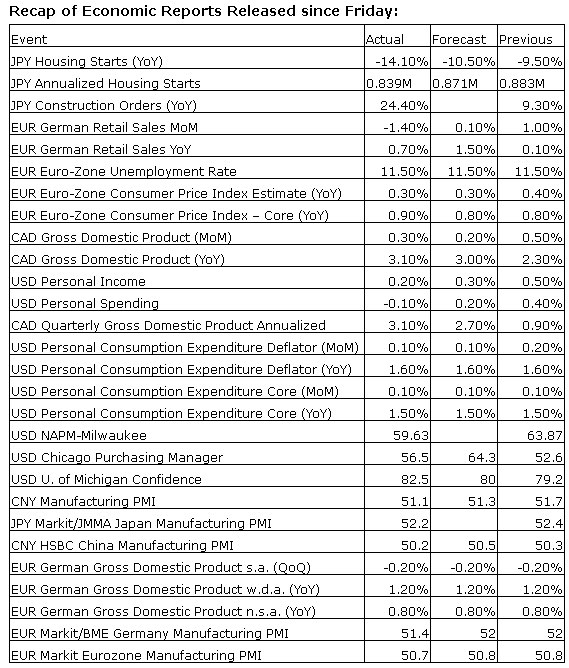
Upcoming US Events for Today:- PMI Manufacturing Index for August will be released at 9:45am. The market expects 57.8 versus 55.8 previous.
- ISM Manufacturing Index for August will be released at 10:00am. The market expects 56.8 versus 57.1 previous.
- Construction Spending for July will be released at 10:00am. The market expects a month-over-month increase of 0.9% versus a decline of 1.8% previous.
Upcoming International for Events for Today:
- Euro-Zone PPI for July will be released at 5:00am EST. The market expects a year-over-year decline of 1.1% versus a decline of 0.8% previous.
- China Non-Manufacturing PMI for August will be released at 9:00pm EST.
- China HSBC Services PMI for August will be released at 9:45pm EST.
The Markets
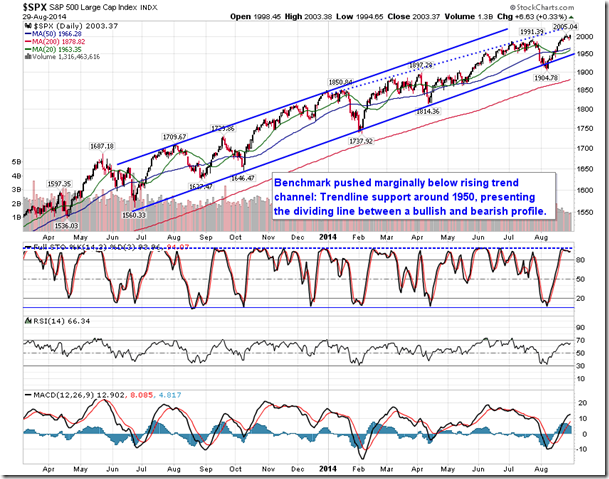
Stocks ended higher on Friday, closing one of the strongest months for the S&P 500 since February. The large-cap index gained 3.77% over the month, rebounding from the selloff that pressured stocks lower at the end of July. The equity benchmark is now back to overbought levels and momentum indicators are showing early signs of stalling. Volume remains significantly low, leading to some questions as to the sustainability of the recent rally.
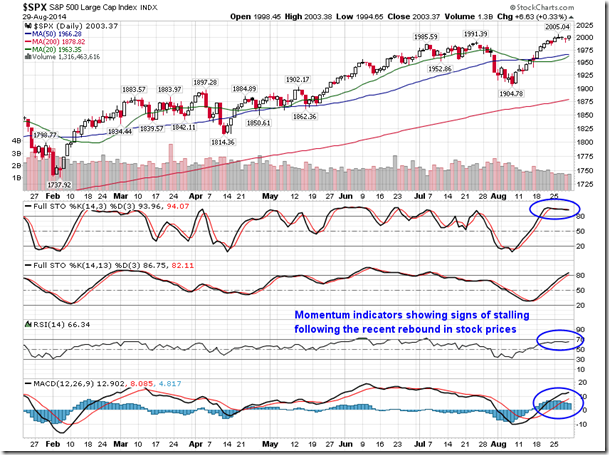
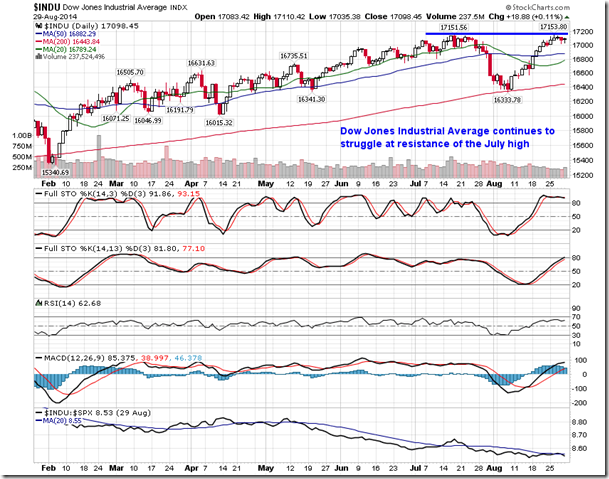
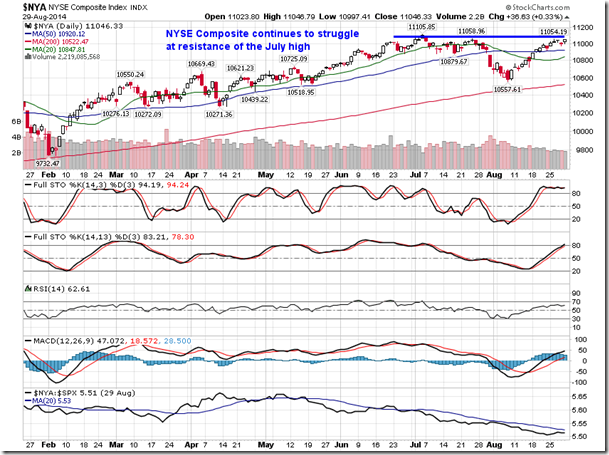
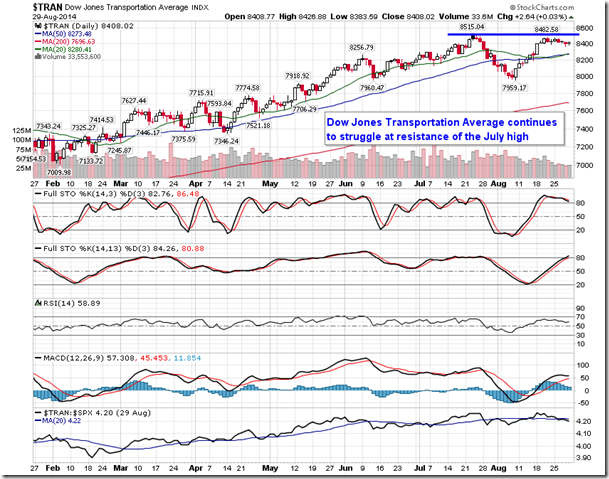
While the S&P 500 continues to chart new all-time closing highs, a number of benchmarks are still struggling to exceed the previous peak charted in July, Including the Dow Jones Industrial Average, NYSE composite, Russell 2000 Index, and Dow Jones Transportation Average. Resistance continues to hang over this market. Investors will be looking to some of these benchmarks to confirm the recent strength realized amongst equity benchmarks over the past few weeks.
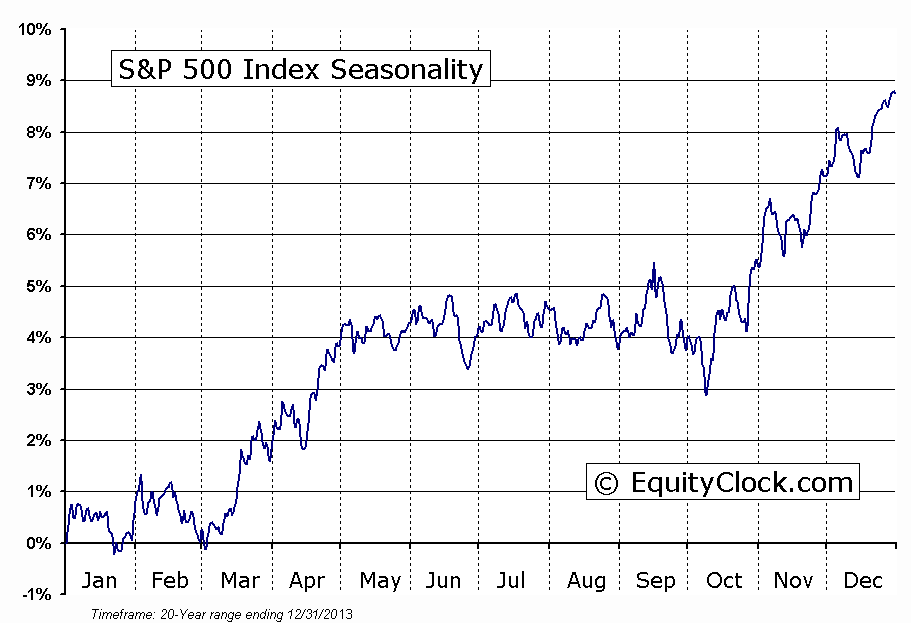
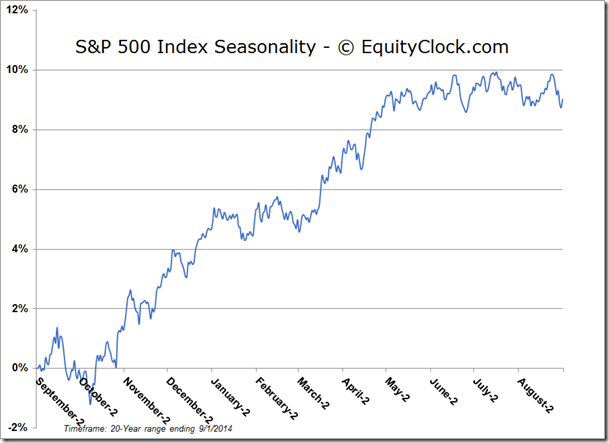
Looking forward, it has often been quoted that September is the worst month of the year for equity markets. Since 1950, the S&P 500 has averaged a decline of 0.6% for the 9th month of the year with losses realized in 46% of periods, making it the worst performing month on a frequency and average return basis. However, results over the past 20 years peg the month of September as the fourth worst performing month, averaging a flat (0.0%) return with positive results recorded in 60% of periods. Whether looking at a seasonal chart of the large-cap benchmark over the past 63 years or the past 20 years, both show a similar pattern: early month strength, followed by late month weakness. Despite the reputation for being a weak month, the S&P 500 has shown gains, on average, during the first couple of weeks of September. The bulk of the losses have been attributed to late-month weakness as fund managers adjust portfolios ahead of the end of the quarter. Seasonal weakness in the areas of employment and manufacturing also tend to weigh on broad market benchmarks as the summer concludes. Best performing sector for the month, based on data from the past 20 years, is Health Care, gaining 1.8%, on average; the weakest is Materials, which has averaged a decline of 1.7%. September is typically the most volatile month of the year and, as a result, defensive assets, such as Health Care, tend to perform better than cyclical counterparts.

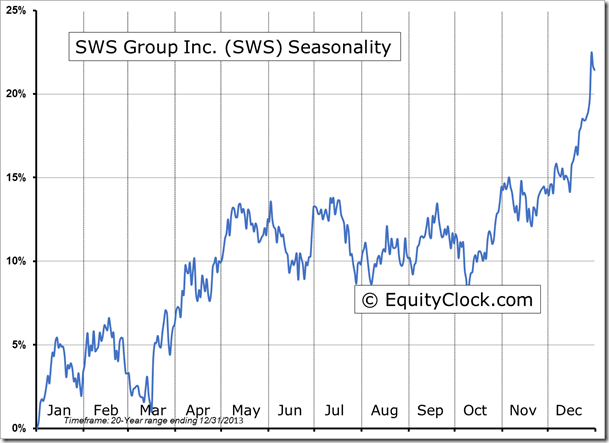
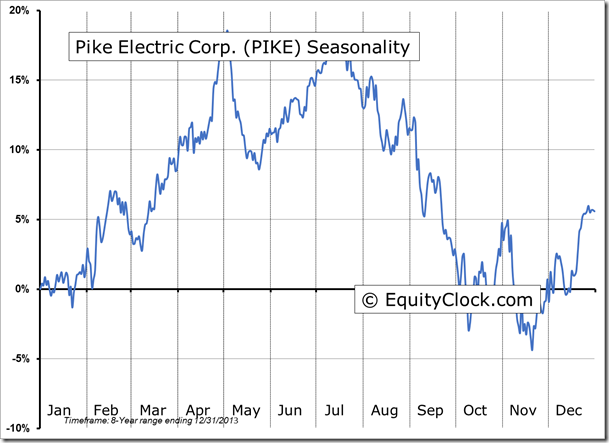
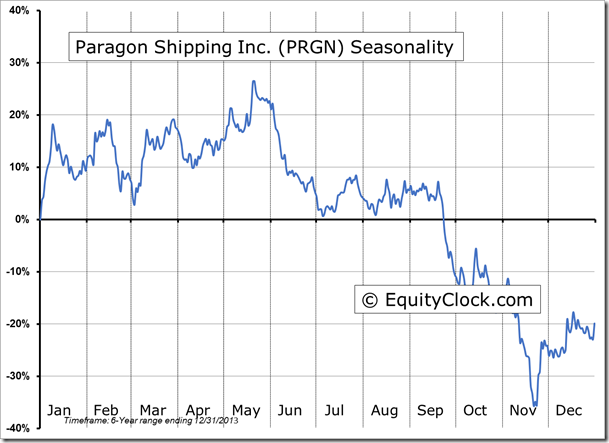
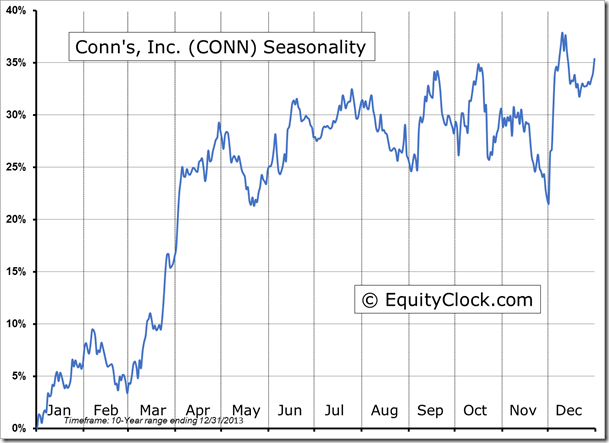
Seasonal charts of companies reporting earnings today:
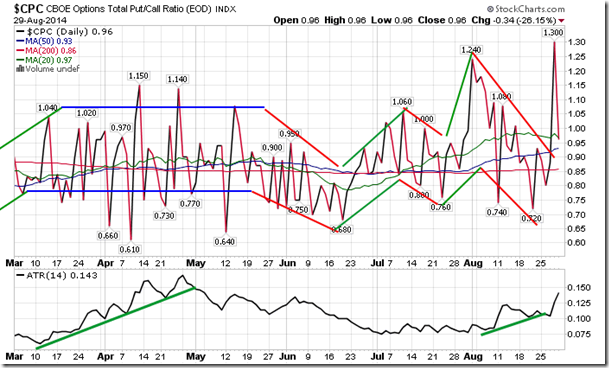
Sentiment on Friday, as gauged by the put-call ratio, ended bullish at 0.96. According to the American Association of Individual Investors, bullish sentiment continues to rise, now at 51.92% of this surveyed. This is the highest since December 26h of last year, raising concerns of investor complacency.
S&P 500 Index
TSE Composite
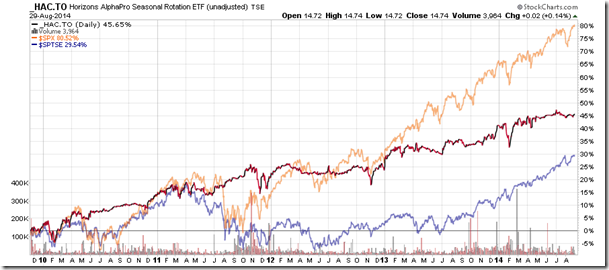
Horizons Seasonal Rotation ETF (TO:HAC)
- Closing Market Value: $14.74 (up 0.14%)
- Closing NAV/Unit: $14.75 (up 0.19%)
Performance*
| 2014 Year-to-Date | Since Inception (Nov 19, 2009) | |
| HAC.TO | 3.15% | 47.5% |
* performance calculated on Closing NAV/Unit as provided by custodian
Click Here to learn more about the proprietary, seasonal rotation investment strategy developed by research analysts Don Vialoux, Brooke Thackray, and Jon Vialoux.
