Get 40% Off
👀 👁 🧿 All eyes on Biogen, up +4,56% after posting earnings. Our AI picked it in March 2024.
Which stocks will surge next?
Unlock AI-picked Stocks

Stock Market Outlook: Equity Markets Likely To Remain On Edge

Published 02/10/2015, 07:19 AM
Updated 07/09/2023, 06:31 AM

Stocks Entering Period of Seasonal Strength Today:

World Wrestling Entertainment, (NYSE:WWE)
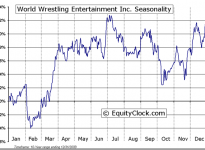
World Wrestling Entertainment, Inc. (NYSE:WWE) Seasonal Chart

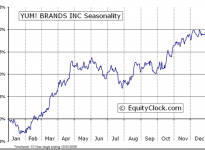
Yum! Brands (NYSE:YUM)

Yum! Brands, Inc.  (NYSE:YUM) Seasonal Chart

The Markets

Stocks slipped on Monday as concerns over Greece turning its back on its debt obligations led to weakness in European benchmarks. The German DAX declined by 1.69%, the French CAC was lower by 0.85%, and the Spanish IBEX fell by 1.97%.

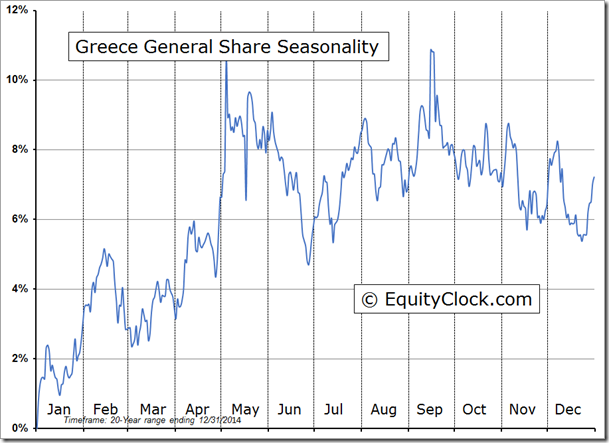
The Athens General Share benchmark shed 4.75%, maintaining the trend of lower-highs and lower-lows that dates back to April of last year. Seasonally, the Greek benchmark tends to perform positively between January and May, however, with the ongoing struggles continuing to overhang the European country, equities have yet shown anything close to the average gains for this time of year; a bottoming pattern has yet to materialize. Greek officials plan on meeting with creditors on Wednesday in hopes to discuss a compromise to current austerity measures; equity markets are likely to remain on edge until some kind of resolution has been met.
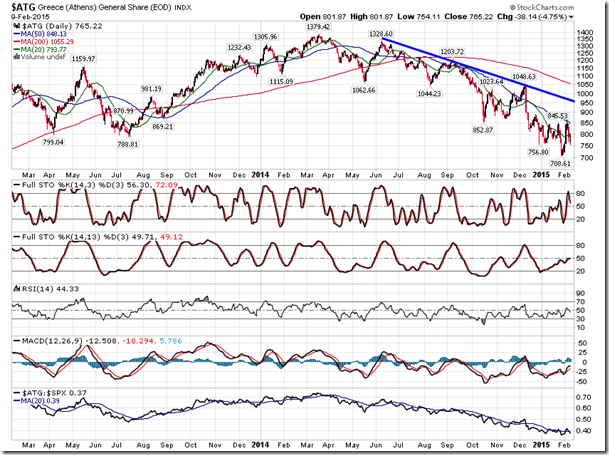
ATG Index Daily Chart

Greece General Share Seasonality Chart

Despite the eurozone concerns that pressured broad equity benchmarks in the US lower during Monday’s session, sector activity remained “risk-on.” Losses during the session were led by Health Care, Consumer Staples, and Utilities, three defensive sectors that typically perform well during periods of investor uncertainty.

3rd party Ad. Not an offer or recommendation by Investing.com. See disclosure here or remove ads .

Cyclical sectors, including Energy, Industrials, and Materials ended around the flatline on the day, bucking the broad market loss. This risk-on sentiment remains a positive for the equity market as investors are more inclined to hold and even accumulate cyclical assets, while letting down their guard in defensive assets, such as bonds. The yield on the 5-Year Treasury Note is holding significant support around 1.2%; trendline resistance that stemmed from the 2007 high was recently tested as support. A break above resistance around 1.8% would confirm a new intermediate-term up-leg.
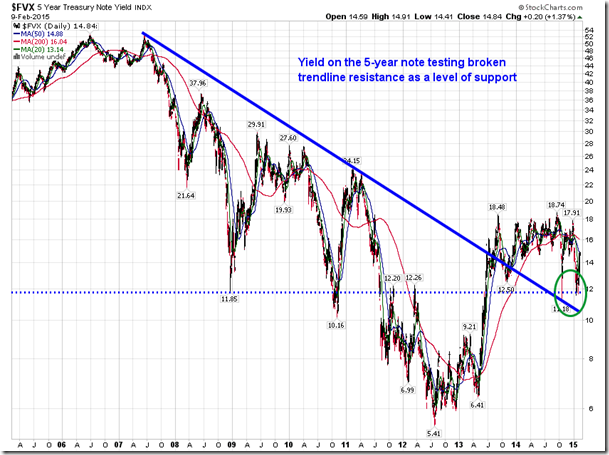
FVX Index Daily Chart

Sentiment on Monday, was gauged by the put-call ratio, ended bearish at 1.07.
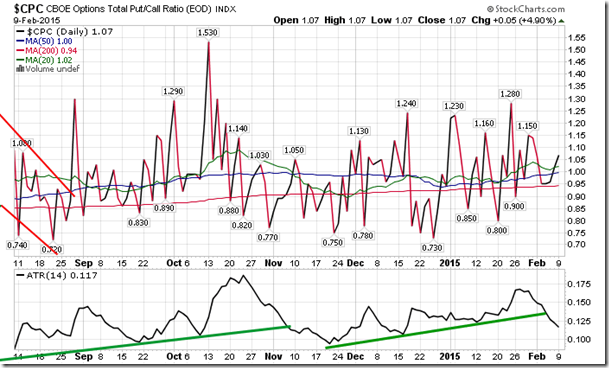
CPC Index Daily Chart

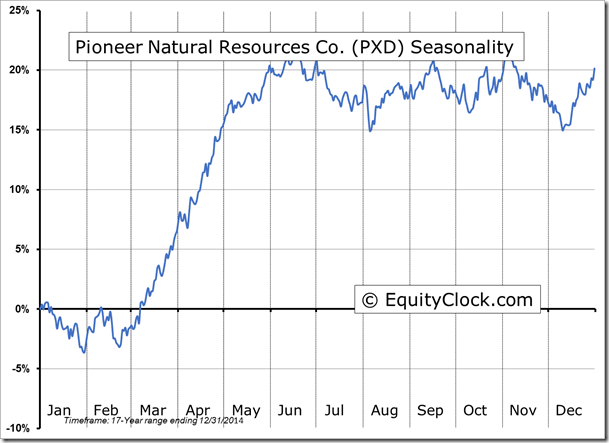
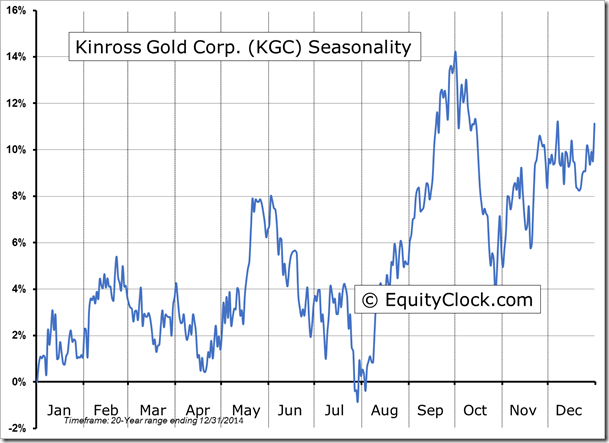
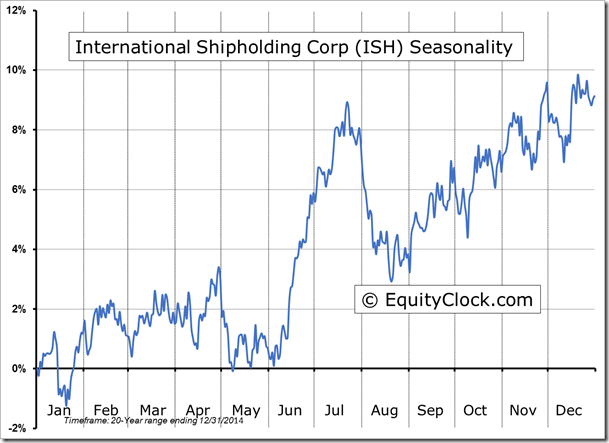
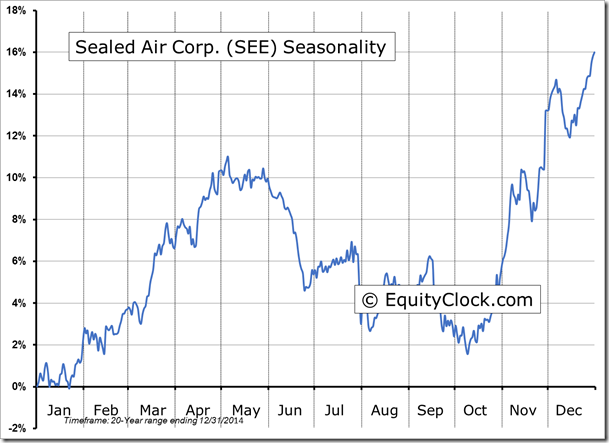
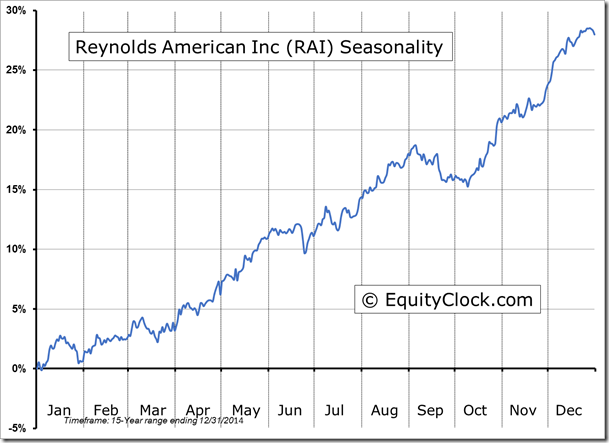
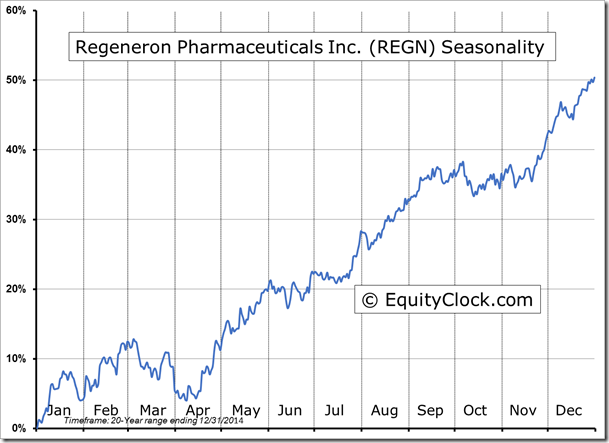
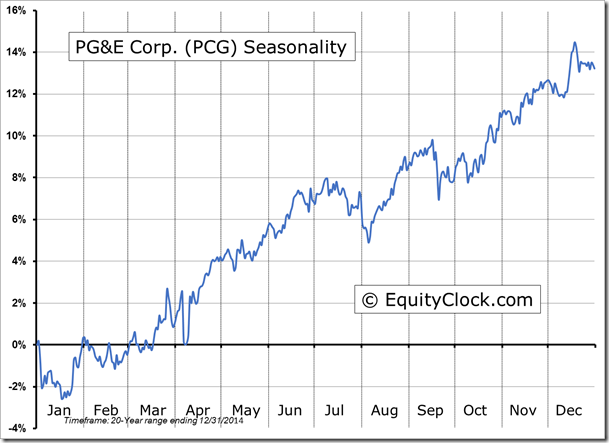
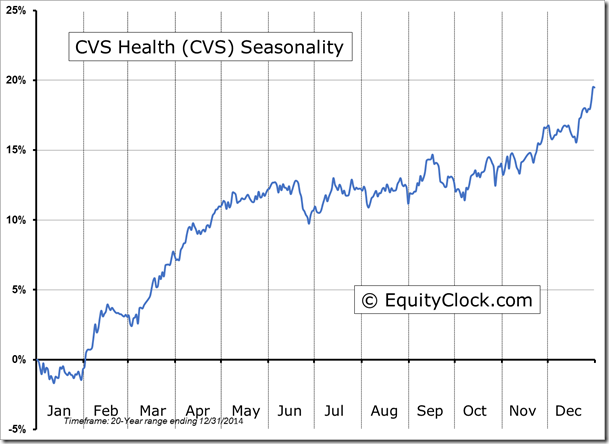
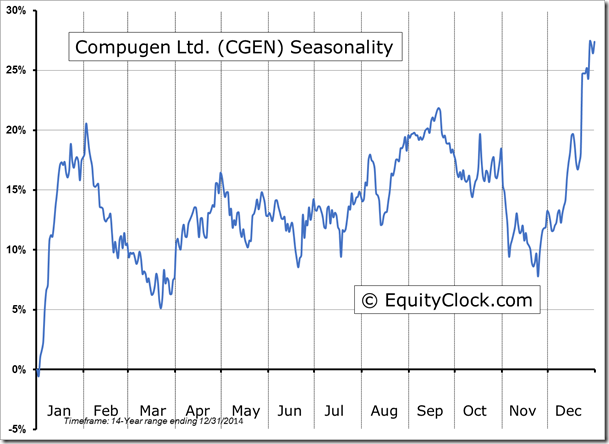
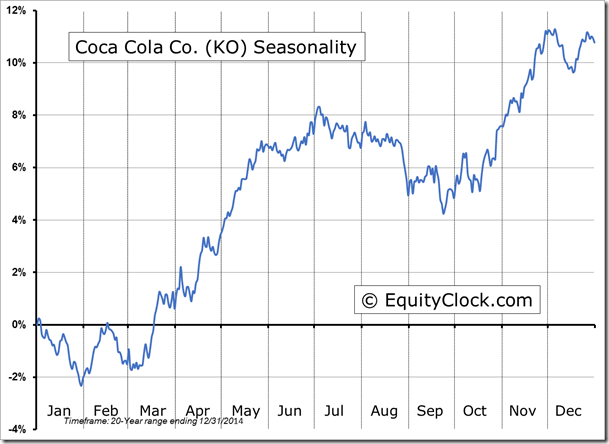
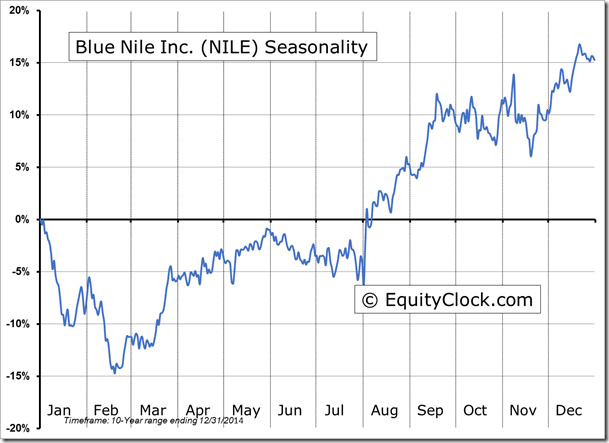
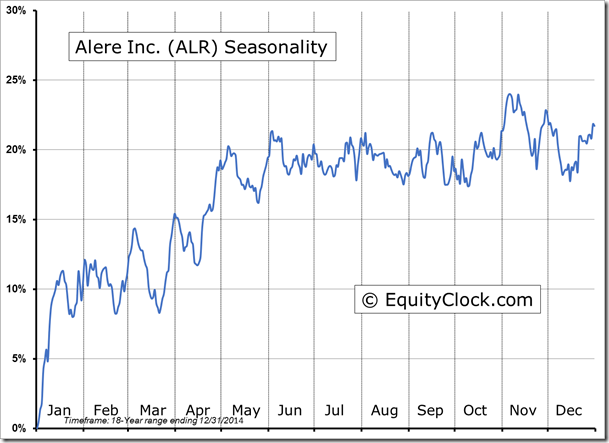
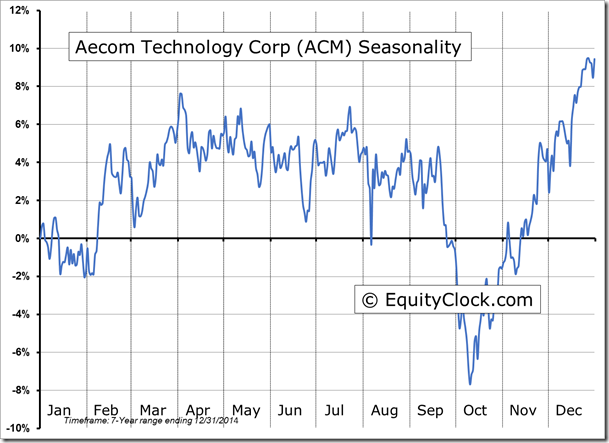
Seasonal charts of companies reporting earnings today:
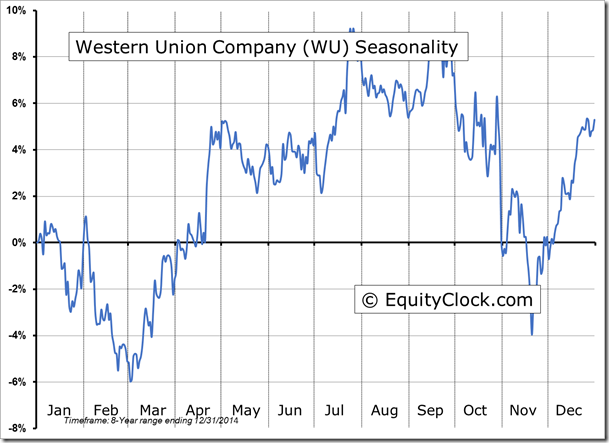
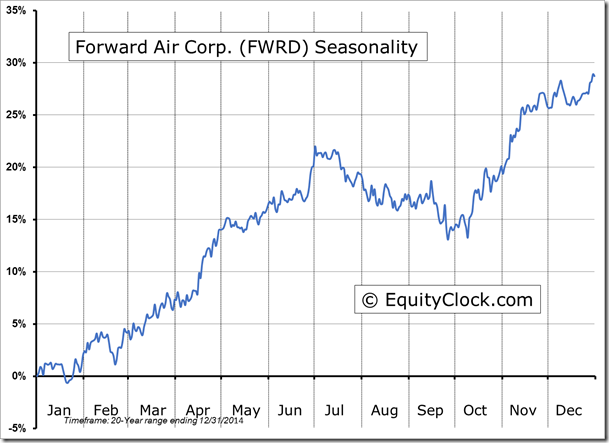
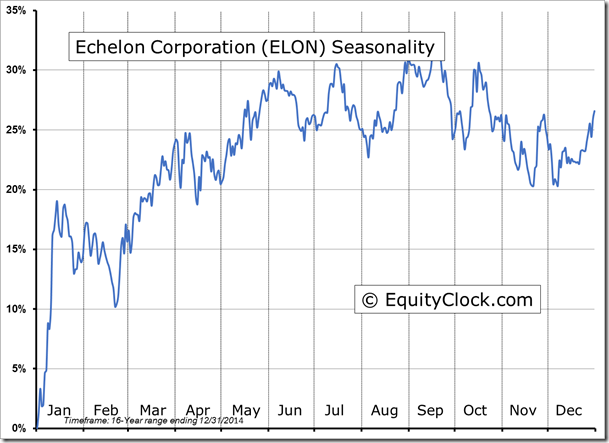
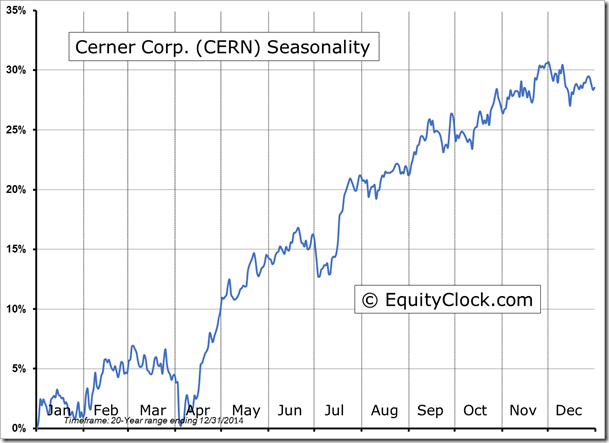
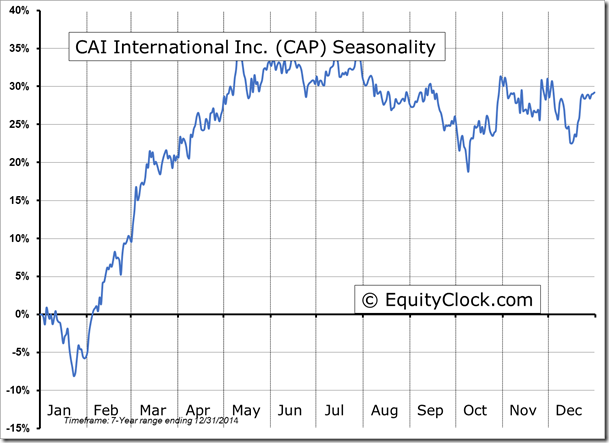
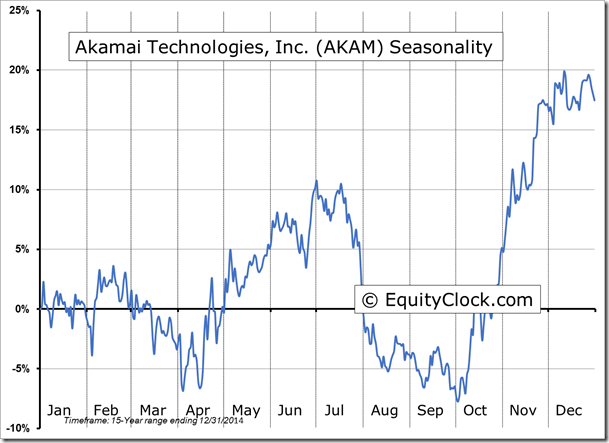
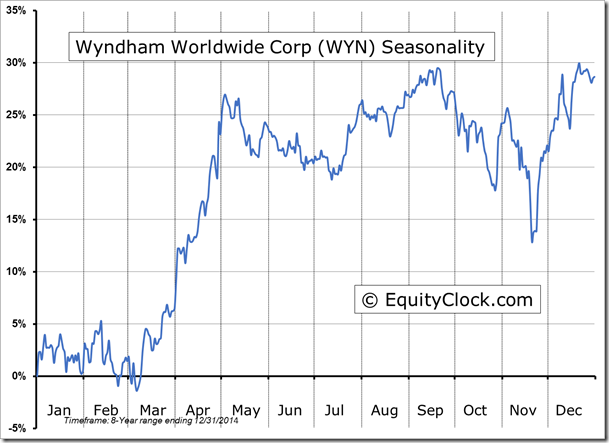
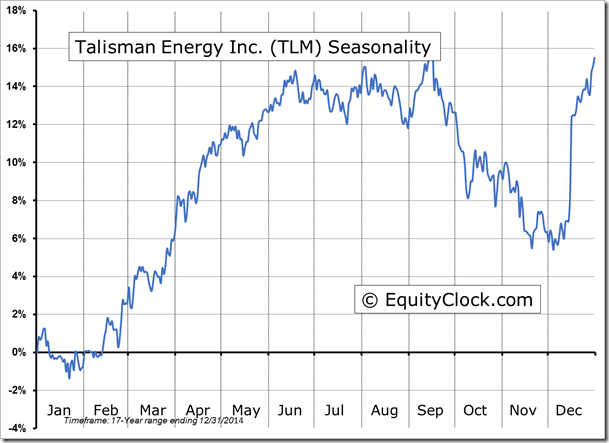
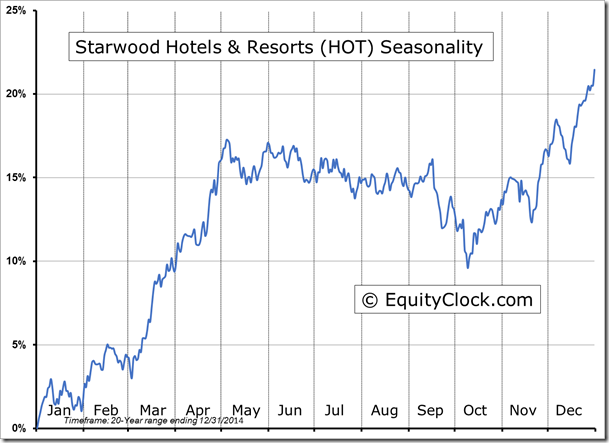
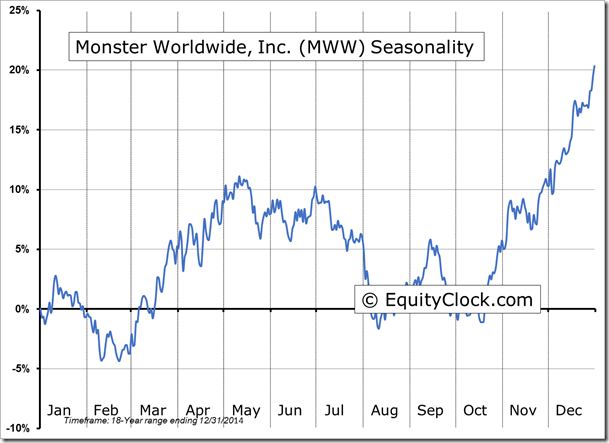
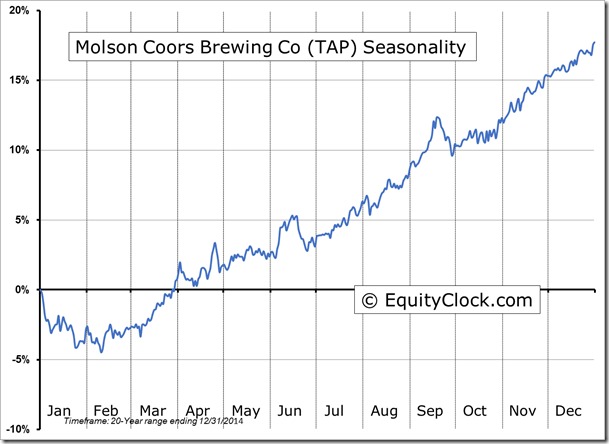
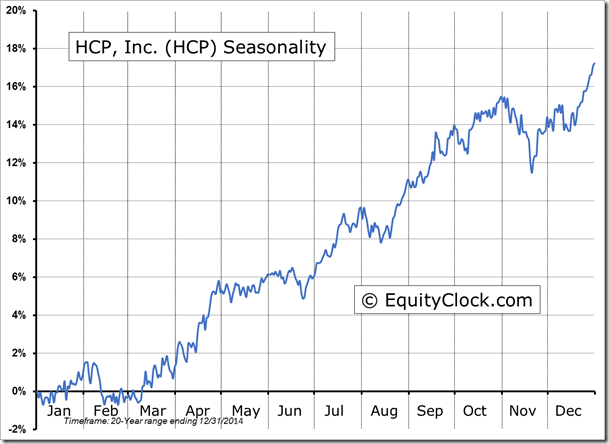
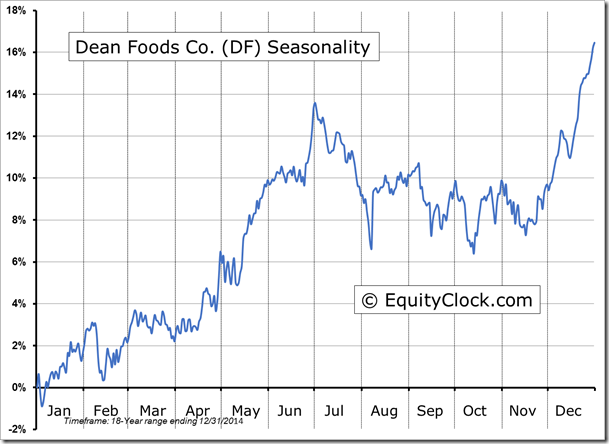
WU  Seasonality chartPXD Seasonality chartKGC  Seasonality chartISH  Seasonality chartFWRD  Seasonality chartELON  Seasonality chartCERN  Seasonality chartCAP  Seasonality chartAKAM  Seasonality chartWYN  Seasonality chartTLM  Seasonality chartHOT  Seasonality chartSEE  Seasonality chartRAI  Seasonality chartREGN  Seasonality chartPCG  Seasonality chartMWW  Seasonality chartTAP  Seasonality chartHCP  Seasonality chartDF  Seasonality chartCVS  Seasonality chartCGEN  Seasonality chartKO  Seasonality chartNILE  Seasonality chartALR  Seasonality chartACM  Seasonality chart

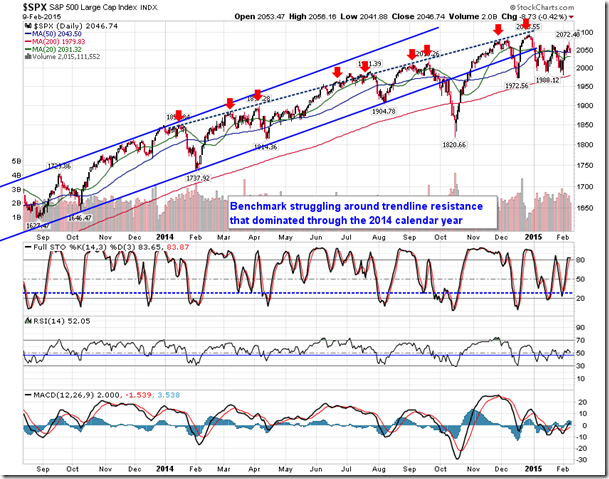
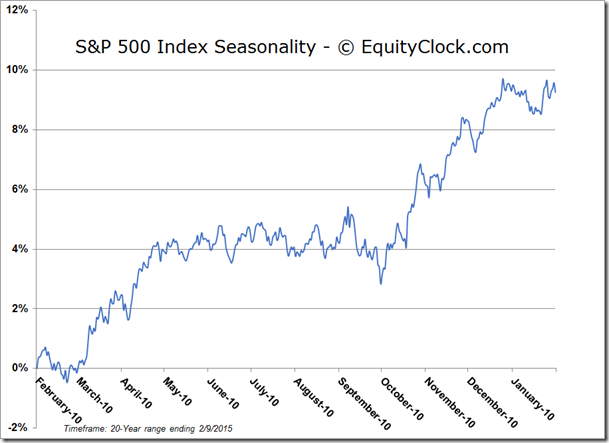
S&P 500 Index

SPX Daily Chart

S&P 500  Seasonality chart

TSE Composite
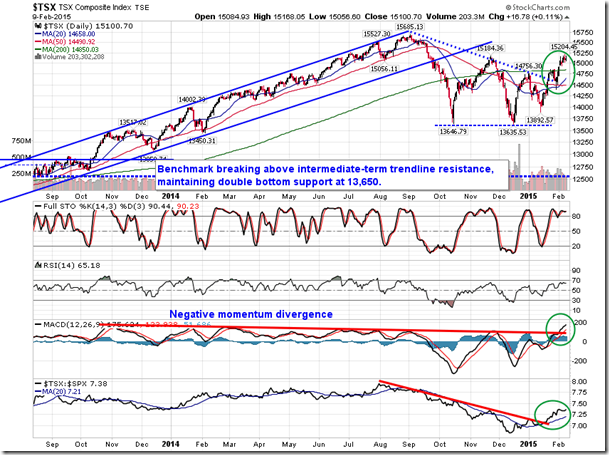
TSX Composite Index Daily Chart

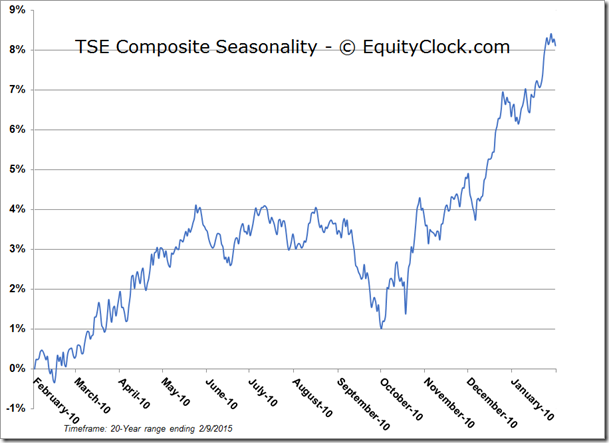
TSE Composite  Seasonality chart
Horizons Seasonal Rotation ETF (TO:HAC)

  • Closing Market Value: $15.86 (down 0.06%)
  • Closing NAV/Unit: $15.87 (down 0.03%)

Performance*

2015 Year-to-DateSince Inception (Nov 19, 2009)
HAC.TO4.89%58.7%
3rd party Ad. Not an offer or recommendation by Investing.com. See disclosure here or remove ads .

* performance calculated on Closing NAV/Unit as provided by custodian
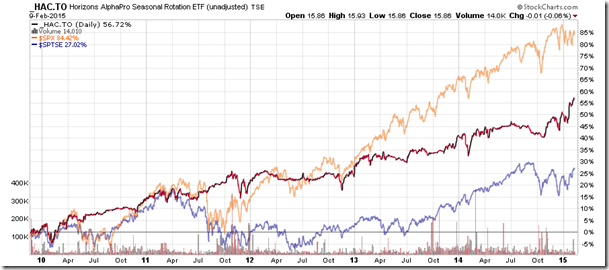
HAC.TO Daily Chart

Disclaimer: Stocks highlighted are for information purposes only and should not be considered as advice to purchase or to sell mentioned securities. As always, the use of technical and fundamental analysis is encouraged in order to fine tune entry and exit points to average seasonal trends.

Latest comments

Risk Disclosure: Trading in financial instruments and/or cryptocurrencies involves high risks including the risk of losing some, or all, of your investment amount, and may not be suitable for all investors. Prices of cryptocurrencies are extremely volatile and may be affected by external factors such as financial, regulatory or political events. Trading on margin increases the financial risks.
Before deciding to trade in financial instrument or cryptocurrencies you should be fully informed of the risks and costs associated with trading the financial markets, carefully consider your investment objectives, level of experience, and risk appetite, and seek professional advice where needed.
Fusion Media would like to remind you that the data contained in this website is not necessarily real-time nor accurate. The data and prices on the website are not necessarily provided by any market or exchange, but may be provided by market makers, and so prices may not be accurate and may differ from the actual price at any given market, meaning prices are indicative and not appropriate for trading purposes. Fusion Media and any provider of the data contained in this website will not accept liability for any loss or damage as a result of your trading, or your reliance on the information contained within this website.
It is prohibited to use, store, reproduce, display, modify, transmit or distribute the data contained in this website without the explicit prior written permission of Fusion Media and/or the data provider. All intellectual property rights are reserved by the providers and/or the exchange providing the data contained in this website.
Fusion Media may be compensated by the advertisers that appear on the website, based on your interaction with the advertisements or advertisers.
© 2007-2024 - Fusion Media Limited. All Rights Reserved.