Dialing back to January of 2013, I am looking for clues about the coming phase for the economy, mostly as an input into whether or not I can think about turning bullish on gold again (here we remind you again of gold’s best investment case, which is counter rather than pro cyclical).
The answer, from a contact in the Semiconductor sector food chain (Applied Materials Inc (NASDAQ:AMAT), Lam Research Corporation (NASDAQ:LRCX), MKS Instruments Inc (NASDAQ:MKSI), etc.) was that the Semi equipment companies, which we called “canaries on the [economic] coal mine”, were ramping up and thus NFTRH’s view became bullish for the economy, at least short-term.
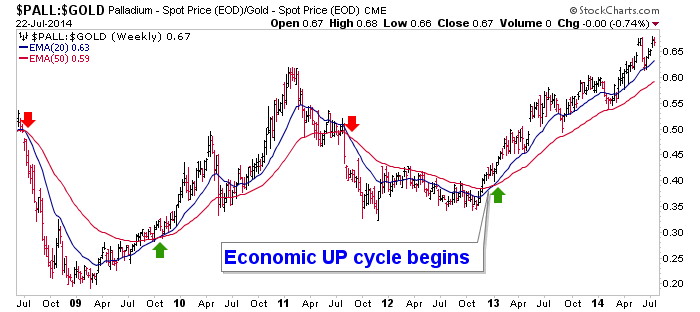
When this information was combined with the following chart of the Palladium-Gold ratio, which had proven a good economic backdrop indicator, the case for a firm economic phase was even stronger. Then followed a string of strong ISM data, a stabilizing ‘jobs’ picture and voila, here we are in Bull Party Central with trend followers everywhere looking good and touting to cement their reputations. But I digress…
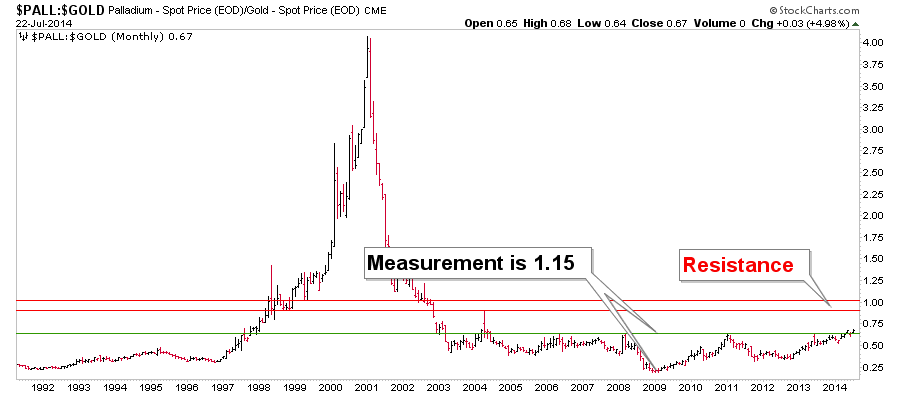
Here is the monthly view of PALL-Gold showing that the economy may not be done yet, although the break above resistance (now support) is still very tentative:
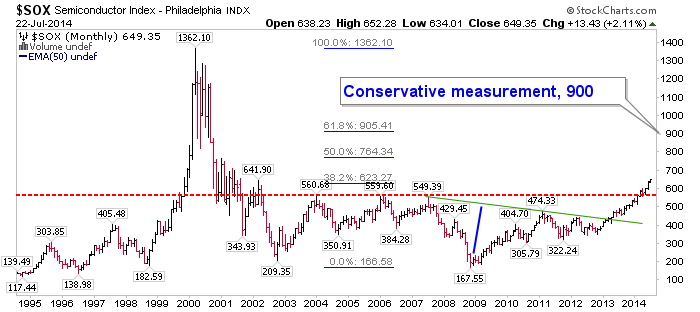
We then began to manage the SOX index (note the eery similarity to PALL-Gold) and its 10 year resistance. This chart was created before the big breakout through resistance and the goofy target was noted as conservative, based strictly on a then would-be breakout and its theoretical measurement. Well, ‘would-be’ now is and resistance is turned to support at around 560.
This led to a search for Semiconductor companies in which to invest. Don’t get caught up in the hype; many of these companies produce commoditized chips and devices. But now that the Wall Street hype machine is turning to the Semi sector, oh about 1.5 years after we did, a rising tide is lifting all boats that can boast the word “semiconductor” in the their name or product line.
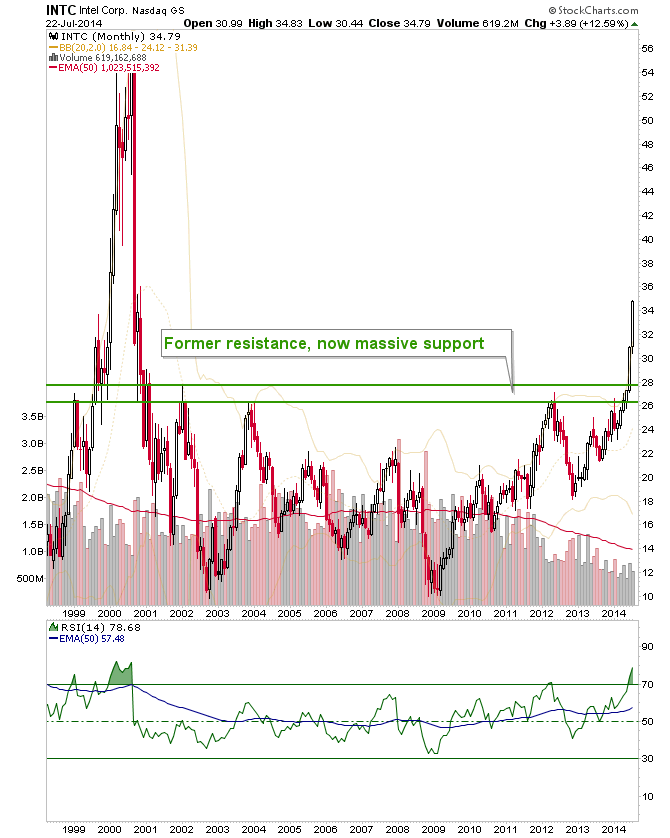
I locked onto Intel (NASDAQ:INTC) due first and foremost to the compelling technical situation (at former 14 year resistance, now massive support) and also the PC chip dinosaur’s entry into the mobile chip market.
The result was a rewarding investment for me personally, and for NFTRH+ as its best stock highlight thus far.
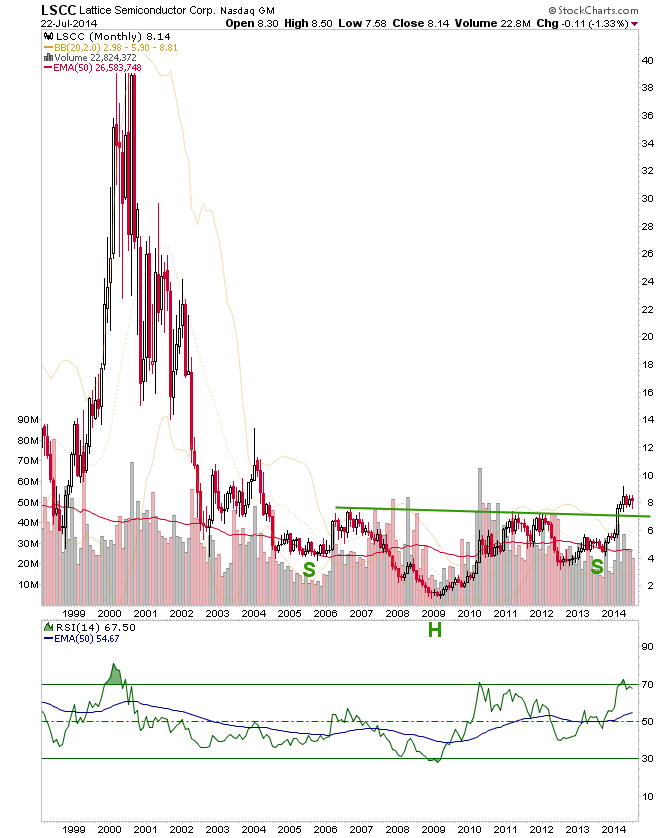
Another ‘+’ highlight was Lattice Semiconductor (NASDAQ:LSCC), which is much more than a maker of commoditized chips, as its FPGA’s have been selected by Google (NASDAQ:GOOGL) to power its Project Ara modular smart phone prototypes due to their “size, power and performance” qualities. The company is already richly valued and initiatives like this are what put the premium on top, along with good quarterly financial performance to date.
I jumped the gun on NFTRH+’s conservative buy target near 7 (buying at around 8) because of this compelling big picture view. A loss was taken pending a personal decision on what to do either before or after earnings are reported, with the reporting date T minus 1 at July 24.
Will the earnings report drive LSCC down to support and a potentially compelling buy or will it drive it up on the way to the measured target of 13, never to be seen down here again? All I can tell you is that if LSCC ever sees the low 7s and if it holds that support, the measured target would call for a near double in the stock price one day, going strictly by the chart. At the Q1 report, management guided ‘flat’.
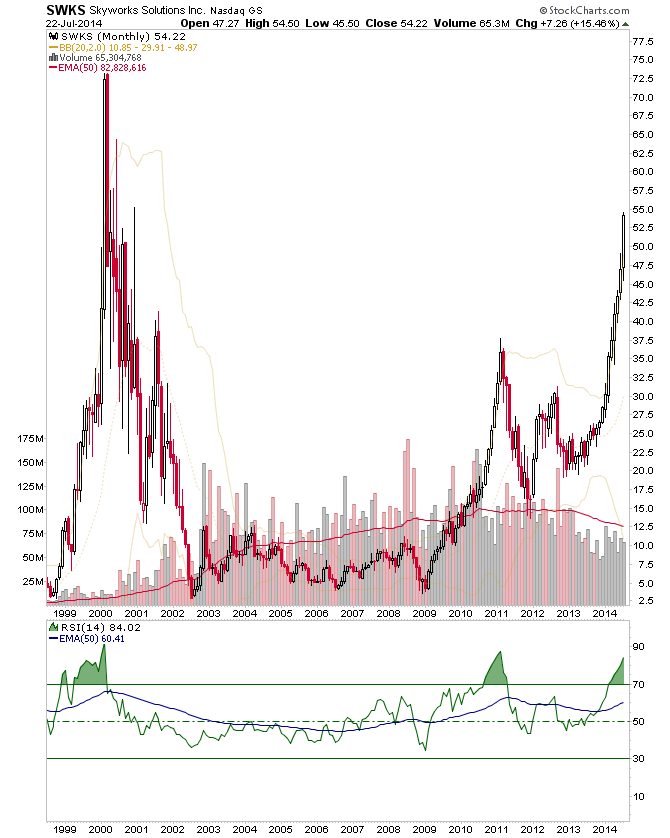
Here is what another (non-commodity) chip maker, Skyworks Solutions Inc (NASDAQ:SWKS) – with Apple (NASDAQ:AAPL) as its daddy, as opposed to Google – has done of late:
The bottom line to all of this is that the Semis have finally gotten in gear, which makes sense since we are on a maturing economic up phase with words and phrases like “mobile”, “wearables” and “internet of things” getting the Wall Street tout that “additive manufacturing” AKA 3D Printing’, got last year.
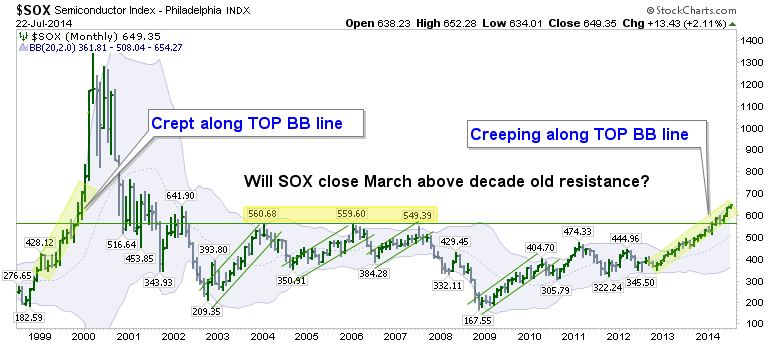
Coming back to the SOX, here's another monthly view we have had going for many months:
This is the one I call the ‘Bollinger® Band Creep’ chart, which I identified months ago, before the big picture breakout, and shows the SOX’ potential to do some representation of what it did in 1999. It is still creeping up the top of the monthly Bollinger Bands for the first time since that epic blow-off that came with a secular bull market termination cherry on top.
SOX is our gateway to a market mania blow-off. Watch it for signs of whether we will get a summer correction or a ‘do not pass go, do not collect $200, go straight to manic (as in ‘silver 2011′) market blow off’. ← Yes, I just had to get some macro into what was for me at least a buttoned down, fairly conventional post.

