The Santa Claus rally broke down. The January effect was DOA. The S&P 500 has gapped higher then faded for most of the days in 2016. Volatility is ramping while chop and noise are absent. Many want to sell at any rally, but there haven’t been any. Equities are becoming more correlated with each other while the entire asset class is trading tick for tick with Energy and Chinese stock prices. If you really want to know what equity prices will do on any given day, you are better off asking your Energy analyst.
It has been a most disappointing start to the year. Many sectors, geographies and half of the S&P 500 components are now trading in their own Bear Market. And Junk Bonds, which were holding up well in the face of falling energy prices, finally gave up this week. I wonder if the Fed would have still raised rates in December knowing where the markets are today.
So keep your head up. Stock prices are limit down into a big earnings season which starts in full force next week. All of the earnings won’t be as disappointing as Alcoa (NYSE:AA), CSX (NASDAQ:CSX) and Intel (NASDAQ:INTC). We should get some relief. Of course, if your analyst tells you that oil will fall to $25, then you know what to do.
Sometimes the simplest explanations are the best…
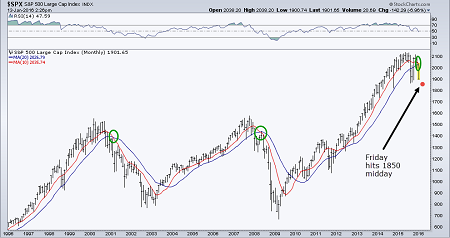
One of the worst signs in the market remains breadth. Small Caps have underperformed large caps for every day in 2016…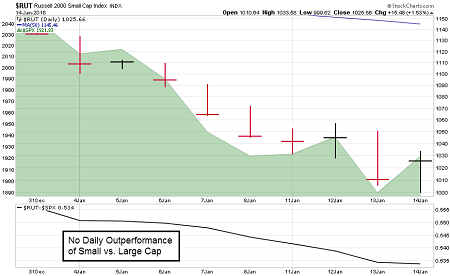
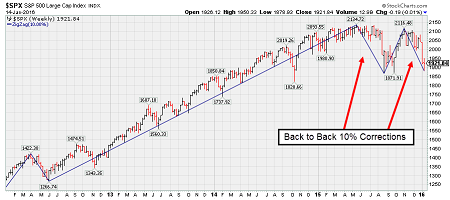
Here is a scary historical study with only a few data points but maybe worth logging into your mental file cabinet…
In an email on Wednesday, Rich Barry, floor governor at the New York Stock Exchange — citing commentary from floor legend Art Cashin — wrote (emphasis added)
Allow me to cut and paste an interesting and ominous piece from Arthur’s morning comments: “Jason Goepfert, the outstanding pilot of SentimenTrader dug into his incredibly extensive files to uncover a rather rare condition. He noted that the indices have had two 10% corrections in a rather short span. That has only happened three times in the last 100 years. Unfortunately, those occurrences were in 1929, 2000 and 2008. As you may recall, those were not particularly good years for the bulls.” Oh boy. Perhaps this time will be different.
The Financial Markets also do not like uncertainty. We know the GOP race is a dogfight… but now the Democrats also?
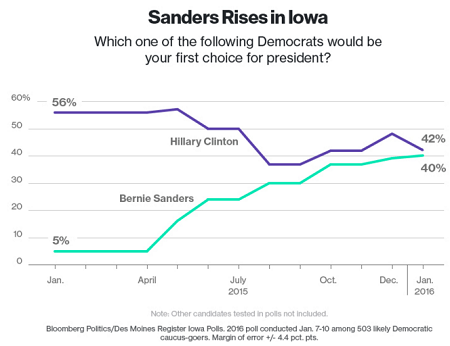
(Bloomberg)
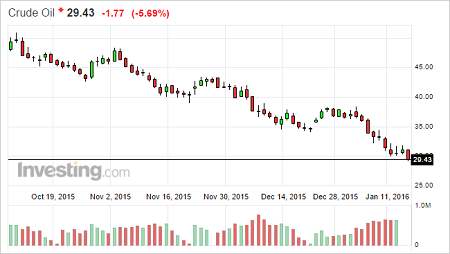
The markets major (you know what) thermometer is still oil…
This China bear market chart added to its woes Friday AM with a -3.5% loss that is not even accounted for below…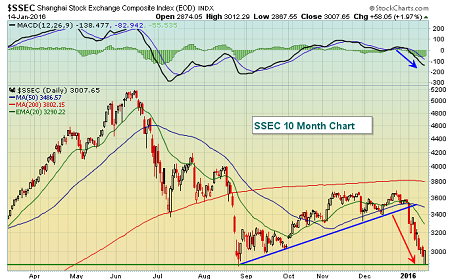
As of Friday morning, several notable ETFs broke into new Bear Market territory…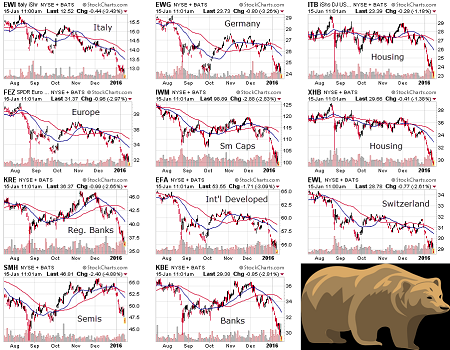
According to Ned Davis, about 50% of the S&P 500 components are already in a bear market…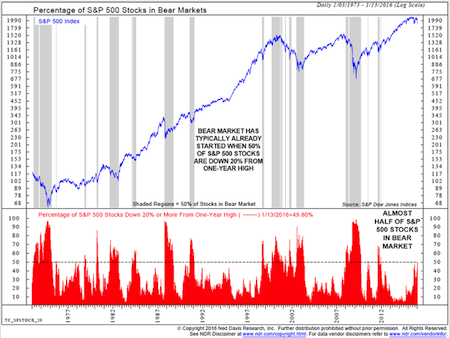
Investors are lowering their global growth and thus Fed rate hike expectations by buying the 2-year Treasury. Check to you FOMC on your four rate hikes in 2016…
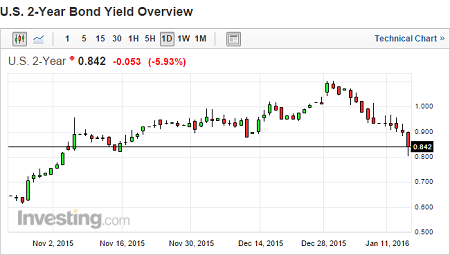
Most troubling to me for the week was the downturn in Junk Bonds…
Breaking through the Third Avenue Value/Barron’s cover story lows set in December was not a good sign. But with many expecting oil prices to $20, there will be blood.
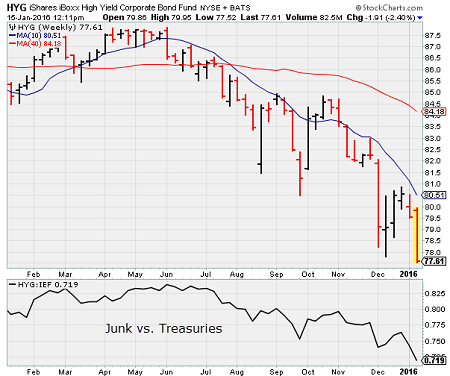
More charts on the jump in Junk and Junk-squared bond yields…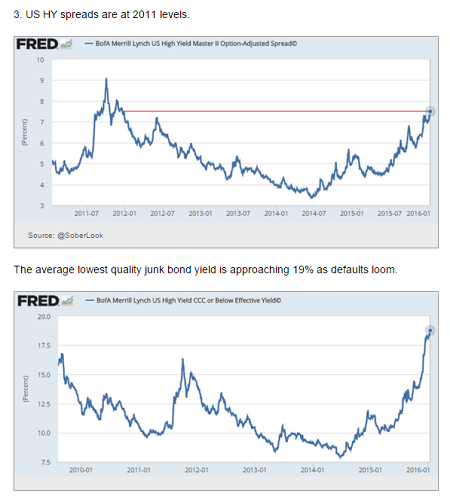
Good news is that the Junk Bond issuance window opened last week. Bad news is that the wider spreads and higher yields cost made Microsemi's (O:MSCC) acquisition of PMC Sierra (O:PMCS) 100 basis points (or 22%) more expensive to finance…
Microsemi has announced that it has secured financing commitments for its acquisition of PMC-Sierra. The financing commitments total $2.9 bn at a blended rate of 5.4%. The new debt will be used to fund the cash portion of the $2.5 bn transaction, to pay transaction fees, and to refinance the existing debt of both companies…
Microsemi also reported that the blended interest rate on the $2.9 bn of debt is about 5.4%, above the roughly 4.4% rate that management initially estimated. An incremental 1% of interest expense on $2.9 bn of debt equates to a roughly $0.28 EPS impact. Recall that Microsemi initially estimated the deal would be more than $0.60 accretive in the first full year when it assumed the blended rate would be about 4.4%.
Sign of the Times: On the flip side of the demand coin is Ambev (N:ABEV) who brought a $45 billion high quality bond offering to market. It was 3x oversubscribed…
Chatter at the start of the week caught portfolio managers off guard after a torrid end to 2015: one of the marquee financings of the year could price in a matter of days, so long as market conditions did not turn.
Despite a steep sell-off in US stocks, and higher financial market volatility this month, calls from bankers in New York and London did not fall on deaf ears.
Anheuser-Busch InBev, the mega brewer, sold a mammoth $46bn bond offering to fund its acquisition of the UK’s SABMiller (L:SAB), the second-largest corporate debt sale in history.
The company attracted more than $110bn in demand — sources put the figure as low as $112bn and as high as $117bn — a record level that allowed AB InBev to tighten spreads across the seven-part offering.
Howard Marks believes that the pendulum is now shifting his way. That is not good news for your risky portfolio…
It all seems so obvious: investors rarely maintain objective, rational, neutral and stable positions. First they exhibit high levels of optimism, greed, risk tolerance and credulousness, and their resulting behavior causes asset prices to rise, potential returns to fall and risk to increase. But then, for some reason – perhaps the arrival of a tipping point – they switch to pessimism, fear, risk aversion and skepticism, and this causes asset prices to fall, prospective returns to rise and risk to decrease. Notably, each group of phenomena tends to happen in unison, and the swing from one to the other often goes far beyond what reason might call for.
That’s one of the crazy things: in the real world, things generally fluctuate between “pretty good” and “not so hot.” But in the world of investing, perception often swings from “flawless” to “hopeless.” The pendulum careens from one extreme to the other, spending almost no time at “the happy medium” and rather little in the range of reasonableness. First there’s denial, and then there’s capitulation.
For those digging into the distressed Junk bond space, the good news is that maturities are very light in 2016. So they just need to make it through the current environment and maybe the firms can survive…
Although energy and metals and mining have been the focus for distressed portfolio managers — the two sectors represent a fifth of the $1.2tn US junk bond market —, the sell-off in lower quality retail, telecom, healthcare and industrial names last year has also presented opportunities, portfolio managers say.
Richard Smith, managing director for leveraged capital markets at Mizuho says although all three leading US credit rating agencies project defaults to rise this year, many companies have already locked in funding for the near term.
Less than $1bn of subordinated, and senior-secured and -unsecured corporate debt that has fallen into distress matures in 2016, according to Standard & Poor’s. The figures climb to roughly $13bn in 2017 and $24bn in 2018 before jumping to $40bn in 2019.
While companies have space before the so-called maturity wall is hit, the size of the distressed market has surged. S&P counts 271 issuers with $233bn of debt in distress, the highest level since 2009.
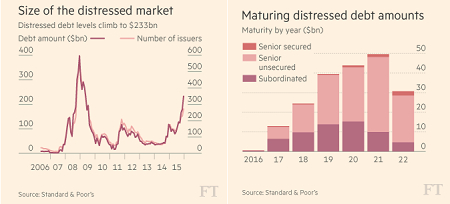
Of course some think that with $20-40 oil prices, even the credit layer of capitalization is worthless…
But with oil falling below $30 and no bottom yet in sight, there is probably further pain ahead in the oil sector, according to Matthew Mish, global credit strategist at UBS, who also contends that prices on junk bonds outside of energy have not come down enough either.
“In energy, bond valuations are pricing in an uplift in underlying commodities, so there’s more downside risk if prices hold at these levels for a long time or go lower,” Mr. Mish said in an interview. And elsewhere, he added, “we do not see a marginal buyer for lower-quality credit.”
As evidence of the disconnect between the free fall in oil prices and energy bond prices, Mr. Mish noted in a report issued on Wednesday that most high-yield issuers’ business models “don’t work with oil in the $20-$40 range.” In this environment, even energy bonds that are trading at distressed levels — 20 cents to 30 cents on the dollar — could be worth “close to zero in reorganization.”
One way out for the distressed firms will be to sell assets to those players flush with cash…
Companies that drill themselves into a hole so deep they cannot escape will be forced to sell assets or tap revolving credit lines. That is a tricky proposition given that many energy players expect to see their borrowing bases cut as debt limits are reduced in light of the plunging value of oil-and-gas reserves in the ground.
More than $100 billion from private-equity firms is waiting in the wings to scoop up assets that are sold either before, or after, bankruptcy, experts say. But major corporate mergers and acquisitions remain unlikely, because any buyer would have to pony up voluminous amounts to cover the debts of a seller.
Instead, opportunistic firms are waiting for the wave of bankruptcies to arrive. Once debt is wiped out, oil-and-gas fields will be cheap. The longer the oversupply sticks, depressing prices, the more companies will falter, leaving their assets ripe for picking at a discount.
“There’s no reason to be anybody’s savior,” said Chad Mabry, a senior energy analyst at FBR & Co. “If you can just get the assets out of bankruptcy, then you don’t have to save anyone.”
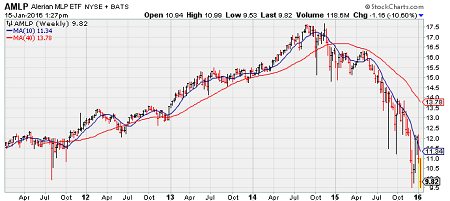
Expect MLPs to be active sellers of assets…
An increasingly common question is whether the MLP model is broken. It isn’t. But its current iteration is straining to keep the high-cost funding and growth model built up during the shale boom. Implicitly, many MLPs are banking on energy prices to rally soon — extraordinary for a sector long viewed as being above the vagaries of the commodity market. If that rally proves elusive, pressure on balance sheets will build further, and the need to reset payments and growth expectations at much lower levels will come into sharper focus.
Two important data points from the JPMorgan (NYSE:JPM) earnings call…
“We’re not forecasting a recession. We think the U.S. economy looks pretty good at this point…obviously, market turmoil we all look at it every day but I’m not sure most of the 143 million Americans look at it that much who have jobs and you have a big change in the world out there. People are getting adjusted to China slowing down…hopefully this will all settle down. It’s not the beginning of something really bad.”
—JP Morgan CEO Jamie Dimon
“I would say that the pipeline coming into 2016 in M&A was good, solid, up in fact. Obviously, volatility can dampen the confidence of Boards and CEOs. Dialogues are pretty active and we think the types of deals that we’ll see in 2016 will look different. But I think in the first couple of weeks it’s not being particularly strong and we do need to see some of the stability come back I think for us to really see our conversions start to pick up.”
—JP Morgan CFO Marianne Lake
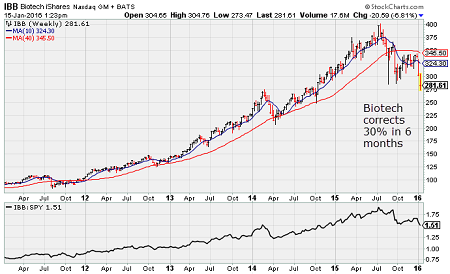
The Pendulum of Psychology is swinging hard in Biotech stocks…
Nothing has changed about the industry’s big negatives, including fears of tighter drug-price regulation. And the industry’s positive themes — lots of drug launches, an active deal climate and potentially blockbuster medical developments — are still in place.
But the positives suddenly lack the same weight. After five years of share-price growth, most of the optimism on display at the JPMorgan conference has already been more than priced in. Firms now need to execute on what they’ve promised and can no longer rely on the sort of leeway a bull market grants.
Many investors were badly burned by the Valeant (N:VRX) controversy and last fall’s stock decline, triggered by Clinton’s tweet and worries about pricing regulation. They are now less inclined to take a company’s stories and projections at face value. And the negative headlines, election-season rhetoric, scrutiny of drug company practices, and generic drug pressures are sticking around this year.
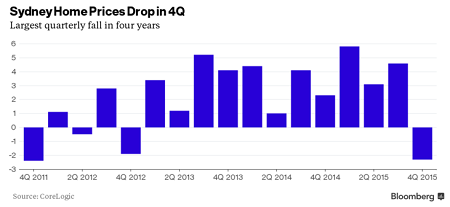
Sydney home prices fell for the second-consecutive month and recorded the worst quarter in four years as a regulatory crackdown pushed up mortgage rates and dented affordability amid record prices.
Home values in Australia’s largest city dropped 1.2 percent in December from a month earlier following a 1.4 percent decline in the previous month, data from property researcher CoreLogic Inc. showed Monday. This is the first time since May 2013 that Sydney dwelling values have dropped for two straight months.
Prices in Australia’s capital cities have jumped almost 55 percent in the past seven years as mortgage rates dropped to five-decade lows and foreigners, including from China, accelerated their purchases of local homes. The gain was led by Sydney where the median home value has almost doubled since 2008. In another sign of a cooling property market in Australia’s most populous city, Sydney home prices fell 2.3 percent in the quarter ended Dec. 31, making it the weakest performing capital city, CoreLogic said in an e-mailed statement.
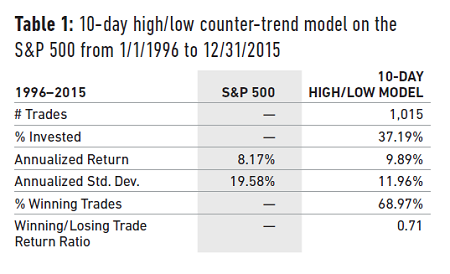
The Team wrote a new paper on Counter-Trend Trading which explains further one of the many Strategies that we employ here at 361 Capital. Hopefully it is of interest to you…
Counter-trend trading models are designed to identify short-term inflection points in the market. There is no universal definition for an inflection point, but they are often associated with instances when the market reaches a short-term extreme and then proceeds to revert from that extreme. To assess whether counter-trend trading works, we need to quantify short-term extremes and then test whether prices tend to revert at these extremes often enough to make counter-trend trading worthwhile. We can use 10-day highs and 10-day lows as a very simple proxy for short-term extremes.
To gauge the efficacy of trading counter to these short-term extremes, the S&P 500 was evaluated over 20 years, from the beginning of 1996 to the end of 2015, using a simple counter-trend model. If the S&P 500 made a new 10-day high, the counter-trend model went SHORT on the close and held the position until the next trading day’s close, betting against the upward momentum of the market. Conversely, if the S&P 500 made a new 10-day low, the counter-trend model went LONG on the close and held the position until the next trading day’s close, betting against the downward momentum of the market. Table 1 summarizes the results. Keep in mind that over this time period the S&P 500 had an annualized return of 8.17% and an annualized volatility of 19.58%.
The information presented here is for informational purposes only, and this document is not to be construed as an offer to sell, or the solicitation of an offer to buy, securities. Some investments are not suitable for all investors, and there can be no assurance that any investment strategy will be successful. The hyperlinks included in this message provide direct access to other Internet resources, including Web sites. While we believe this information to be from reliable sources, 361 Capital is not responsible for the accuracy or content of information contained in these sites. Although we make every effort to ensure these links are accurate, up to date and relevant, we cannot take responsibility for pages maintained by external providers. The views expressed by these external providers on their own Web pages or on external sites they link to are not necessarily those of 361 Capital.
