In this article I will provide my view on the EUR/CAD, USD/CAD and GBP/AUD. These are the pairs that I am currently interested in or was interested in last week for trading with the Hybrid Grid strategy. I will pick one to analyse in more detail from the pairs that have not been discussed yet recently.
- All trades are based on specific rules according to the FxTaTrader Hybrid Grid strategy.
- For the performance and closed positions click here.
This article will provide:
- The weekly currency chart for the analyzed pair.
- The weekly(decision) TA chart for the analyzed pair.
- A Technical analysis for the analyzed pair of the Daily, Weekly and Monthly chart.
- Possible positions for the coming week and positions taken.
According to the TA Charts, the "Currency score" and the "Ranking & Rating list", all the pairs in the Top 10 of the "Ranking & Rating list" are good to trade except for EUR/AUD. These are 2 weaker currencies with a currency score difference of only 3.
There are some rules for taking positions according to the FxTaTrader Hybrid Grid Strategy. The strategy can open multiple positions of a currency pair but each currency may only be present once in the same direction in the pairs chosen for trading. It means that not all the possible positions of this coming week can be opened. For more information see FxTaTrader Hybrid Grid Strategy. Another rule is that a pair outside the Bollinger Band in the Weekly chart is considered overbought/oversold.
For the coming week no positions will be opened because of the holidays coming soon and the lower liquidity in the coming period.
Last week (pending) orders were placed for the EUR/CAD, USD/CAD and the GBP/AUD with, unfortunately, loss 3x EUR/CAD and profit 2x USD/CAD and 1x GBP/AUD. See the Performance page on my blog for more details.
Open/pending positions of last week
EUR/CAD
This pair will be analyzed briefly, for more information read the article Review FxTaTrader Strategy Wk 47/48. Loss was made last week on 3 positions.
The pair looked interesting in the last few weeks for going short. The pull back in the last weeks offered a good opportunity. However, the pull back was stronger than expected and the stop loss on the open positions got hit. The EUR has gained strength this week and is having a Currency Score of 4 which is 1 point higher compared to last week. The CAD on the other hand got a lot weaker this week and has a Currency Score of only 2. Price got to the higher side of the range where a 50% (Fibo) level was present at 1.4310 measured from the high 1.4733 of Aug. 7 and the low 1.3882 of Nov. 23. The last short position was opened around this level. Based on the longer term view where the CAD is the better currency the probabilities were high to reach an end to the pull back and the downtrend resuming after consolidating around this 50% level. This took only 2 days and the pair broke through hitting the stop loss which was placed about 25 pips higher to avoid being hit because of only noise.
The pair looks still Bearish in the Weekly chart but in the Daily chart it looks Bullish. At this moment avoiding this pair seems the best.
Ranking and rating list Week 51
Rank: 9
Rating: +
Total outlook: Neutral
USD/CAD
This pair will be analyzed briefly, for more information read the article Review FxTaTrader Strategy Wk 48/49. Profit was made last week on 2 positions. The situation compared to the last weeks has improved and the pair looks interesting for the Hybrid Grid strategy. After the strong pull back in the weekly chart a few weeks ago the pair made a strong rebound in the last weeks. The indicators are looking fine for going long and the pair is in an uptrend.
- In the daily chart the Ichimoku is not meeting all the conditions.
- The MACD is in positive territory and looking strong.
- The Parabolic SAR is long showing the preferred pattern of higher stop loss on opening of new long and short positions.
Ranking and rating list Week 51
Rank: 5
Rating: + +
Total outlook: Up
GBP/AUD
This pair will be analyzed in more detail. The situation compared to the last weeks has improved and the pair is interesting for the Hybrid Grid strategy. The pair broke through the highs of last weeks and is clearly in an uptrend in the Daily, Weekly and Monthly charts. Profit was made last week on 1 position.
- As can be seen in the Currency Score chart in my previous article of this weekend Forex Weekly Currency Score Wk 51, the AUD is having a score of 1 and the GBP a score of 5. With a Currency score difference of 4 and the GBP having a classification of an average performer currency while the AUD is a weaker currency it is an interesting pair in the coming week for going long.
- The position in the Ranking and Rating list in the last weeks also shows that the pair is attractive for taking long positions. In the current list of this weekend Forex Ranking & Rating Wk 51 the pair has a rank of 6. This list is used as additional information besides the Currency score and the Technical analysis charts.
- Besides the general information mentioned the outlook in the TA charts also makes it an attractive opportunity.
Ranking and rating list Week 51
Rank: 6
Rating: + +
Weekly Currency score: Up
Based on the currency score the pair looked interesting in the last 3 months, however not for the coming week. The NZD is an average performing currency from a longer term view and currently having a currency score of 4. The AUD is also an average performing currency from a longer term view and currently having a score of 2. Based solely on this information the pair does not look interesting for going short in the coming week.
Monthly chart: Up
- On the monthly(context) chart the indicators are looking reasonable for going long.
- The Ichimoku is not meeting all the conditions with price being in the cloud. The MA's crossed but this did not happen above the cloud.
- The MACD is in positive area and regaining strength.
- The Parabolic SAR is short but showing the preferred pattern of higher stop loss on opening of new long and short positions.
- Since the monthly chart is used to get the context how that pair is developing for the long term the indicators are looking fine because they are showing strength in the current uptrend.
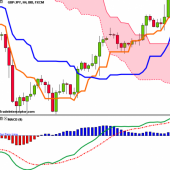
Weekly chart: Up
- On the weekly(decision) chart the indicators are looking strong for going long.
- The Ichimoku is meeting all the conditions.
- The MACD is in positive area regaining strength.
- The Parabolic SAR is long but not showing the preferred pattern of higher stop loss on opening of new long and short positions. However this pattern is being developed with new highs made in the recent period.
Daily chart: Up
- On the daily(timing) chart the indicators are looking strong for going long.
- The Ichimoku is meeting all the conditions.
- The MACD is in positive area and looking strong.
- The Parabolic SAR is long but not showing the preferred pattern of higher stop loss on opening of new long and short positions. However this pattern is being developed with new highs made in the recent period.
Total outlook: Up
GBP/AUD Weekly chart
Although the explanation may seem simple and clear there is always risk involved. I added a disclaimer to my blog for this purpose. If you like to use this article then mention the source by providing the URL FxTaTrader.com or the direct link to this article. Good luck in the coming week and don't forget to check my weekly Forex "Ranking and Rating list" and the "Currency Score".
Disclaimer: The articles are my personal opinion, not recommendations, FX trading is risky and not suitable for everyone.The content is for educational purposes only and is aimed solely for the use by ‘experienced’ traders in the FOREX market as the contents are intended to be understood by professional users who are fully aware of the inherent risks in forex trading. The content is for 'Forex Trading Journal' purpose only. Nothing should be construed as recommendation to purchase any financial instruments.