Talking Points
- Gold and Silver Recover Ground As Their US Dollar Counterpart Stumbles
- Crude Oil At A Critical Juncture With Bullish Fundamental Cues Lacking
- Platinum Traders Near Multi-Year Low As Technicals Warn Of Further Weakness
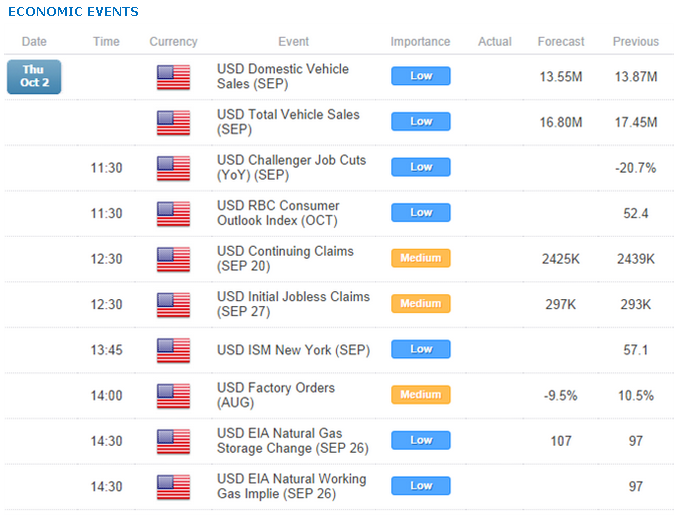
Crude oil has stabilized during the Asian session today after suffering another drop in trading on Wednesday. Reports of prices cuts by OPEC producer, Saudi Arabia overshadowed a surprise climb in US inventories for the week. Anticipation over ample global crude supplies remains a dominant driver behind weaker oil prices. Alongside a light US economic docket over the session ahead, the commodity may be left lacking bullish fundamental cues. Nonetheless a consolidation may be afforded given some hesitation from traders near the WTI’s 2014 lows.
Meanwhile, gold and silver are pushing higher in early trading as broad-based weakness for their US Dollar counterpart takes hold. 11 straight weeks of gains for the greenback have left the door open to profit-taking. Furthermore, traders will likely be reluctant to add to long positions ahead of the release of the volatility-inducing US jobs report due on Friday. This in turn may offer the precious metals some breathing room.
Geopolitical concerns may also provide some background noise for the commodities space. Jitters surrounding unrest in Hong Kong may generate some short-term haven demand for gold. However, the potential for these concerns to quickly dissipate suggests the yellow metal will have to search elsewhere for a more sustainable source of support.
Finally, Natural Gas may be in store for another volatile session after the energy commodity slumped by over 2 percent on Wednesday. Storage figures set to cross the wires today are tipped to reveal an injection of 105.88 billion cubic feet. Another injection above the seasonal average could amplify supply glut anticipation and make a recovery a difficult feat for the commodity.

CRUDE OIL TECHNICAL ANALYSIS
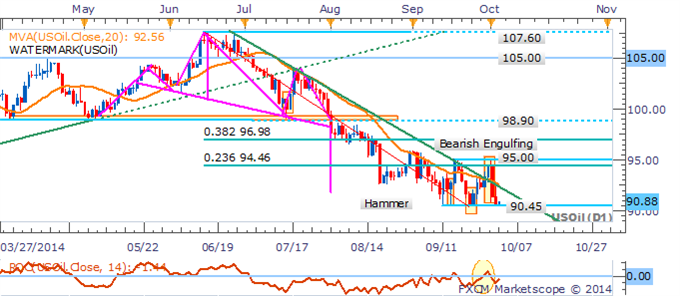
Crude oil remains at a critical juncture after being slapped back towards its 2014 low near 90.45. There are warning signs of a potential downside break of the barrier following the emergence of a Bearish Engulfing formation. A daily close underneath the nearby floor could pave the way for a descent on the 2013 low at 85.45.
Crude Oil: Awaiting Break After Being Slapped Back To Critical Support
GOLD TECHNICAL ANALYSIS
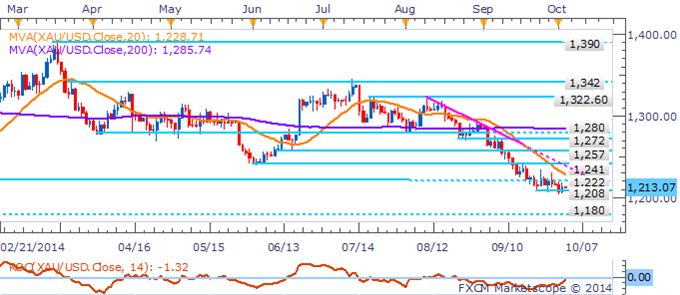
Gold continues to endure a consolidation between the 1,208 and 1,222 congestion zone. Yet against the backdrop of broader downtrend a more convincing daily close below the 1,208 floor would open the next leg lower to the 2013 lows near 1,180.
The DailyFX SpeculativeSentimentIndex suggests a bullish bias for gold based on trader positioning.
Gold: Focus To Shift To 1,180 On Break Below 1,208
SILVER TECHNICAL ANALYSIS
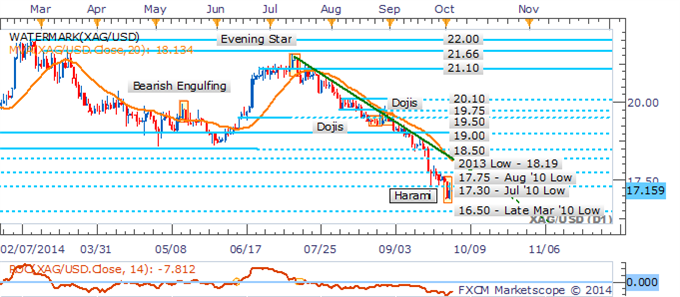
Silver’s recent rebound is seen as corrective within the context of a broader downtrend on the daily. Downside risks remain for the precious metal while sub the 17.30 barrier, which keeps the spotlight to the low seen in late March ’10 near 16.50. A daily close over the 17.30 mark would be required to confirm a Harami formation and suggest a small base may have formed.
Silver: Downside Risks Remain While Sub 17.30
COPPER TECHNICAL ANALYSIS
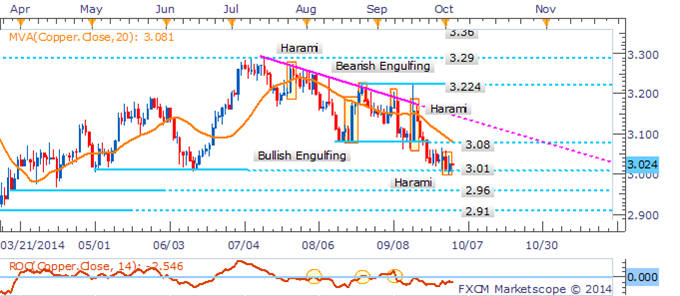
Copper has managed to regain its footing at the 3.01 floor after it failed to post a more convincing daily close below the barrier. While a Harami pattern indicates the potential for a shift in sentiment, it lacks validation from an ensuing up-day. Amid the presence of a short-term downtrend this leaves the base metal to await a break below 3.01 to set the scene for a descent on the 2.96 barrier.
Copper: Awaiting Break Amid Broader Bearish Backdrop
PALLADIUM TECHNICAL ANALYSIS
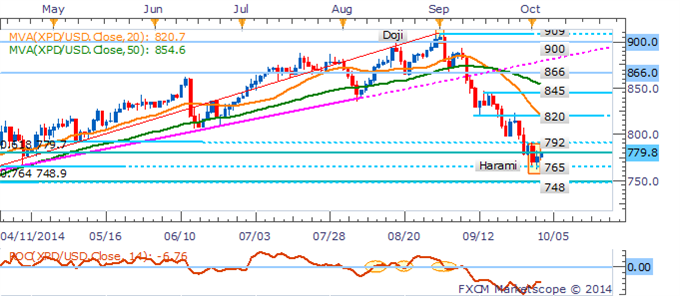
Palladium is retesting the 61.8% Fib near 780 following the emergence of a Harami formation. At this stage the recovery is seen as corrective rather than indicative of an emerging uptrend. Alongside broader bearish signals a break below buying interest at 765 would open the 76.4% Fib. near 748.
Palladium: Retesting Fib. Level With Core Downtrend Intact
PLATINUM TECHNICAL ANALYSIS
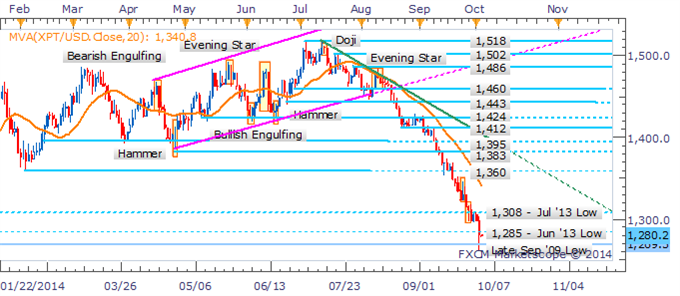
Platinum’s voyage into territory not seen since 2009 has left the precious metal with thin buying interest. Coupled with a core downtrend the stage may be set for further weakness for the precious metal. The close below the 1,285 floor may open up a retest of the 1,260 handle.
Platinum: Primed For Further Weakness Following Plunge Below 1,285