Opening Calls:
FTSE 5877 -45
DAX 9497 -84
CAC 4250 -34
IBEX 8443 -86
Contents:
1. PBOC: sweet words, but a sword in their belly? – Angus Nicholson
2. Trade idea - Play falling oil through long USD/CAD positions – Chris Weston
3. Oil is the VIX best friend – Evan Lucas
PBOC: sweet words, but a sword in their belly? – Angus Nicholson
What a difference oil below US$30 makes. Negativity has crept back into the oil price now that the short-covering rally has run its course, Chinese PMIs have disappointed and quixotic hopes for a Saudi-Russian supply cut deal have evaporated. And oil’s deflationary effects are taking their toll on equities again today.
The worst of the selling in Asia was seen in Japan and Hong Kong. A flurry of Chinese announcements over the past 24 hours, including tightening foreign insurance purchases and lowering housing downpayments seem to have only heightened concerns over China’s slowdown. The implementation of stricter capital controls seems to be all stick and no carrot for sentiment on China’s economy. Increasingly draconian capital controls and flat-out denials of future currency devaluation seem unlikely to fix the problem of China’s declining FX reserves.
There is a Chinese proverb (chengyu) that roughly translates as “sweet talking but a sword in the belly” (koumi fujian 口蜜腹剑). Behind the denials of the PBOC, they are still hiding the sword of CNY devaluation in their belly.
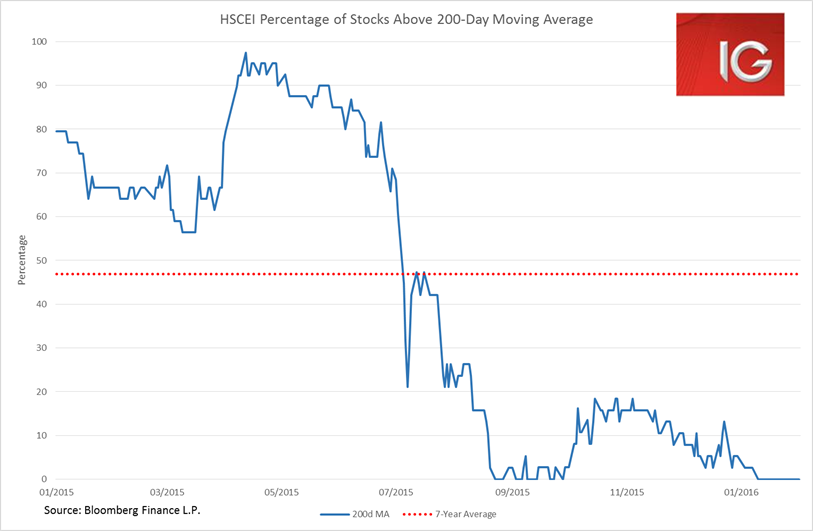
Hong Kong stocks were in full capitulation today, with both the H-share and Hang Seng indices losing roughly 3%. The H-share index was trading at its lowest levels since 2009, and when one looks at the market internals the true evaporation of sentiment on the index becomes clear. Exactly zero stocks have traded above their 200-day moving average since 8 January – the market internals are flatlining.
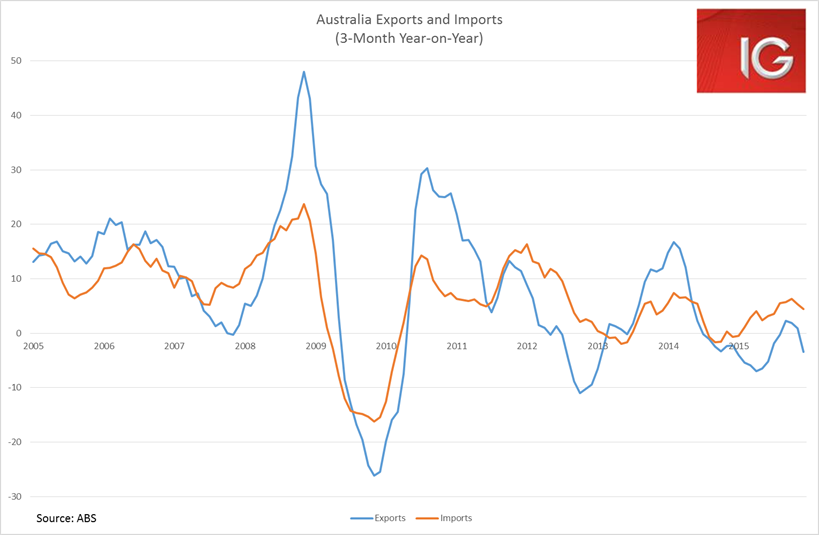
The Aussie dollar took another hit today with the dramatic deterioration in the December trade data. Given the 10.8% YoY increase in Chinese iron import volumes in December, one would have expected slightly better Australian trade numbers, although inflated trade numbers due to hidden FX flows seem to be an increasing concern in the Chinese trade data. The fact that Australia’s export price index declined a further 10.3% in the fourth quarter did not help the trade data in value terms. Even then, the dramatic 32.5% YoY decline seen in Australia’s iron ore exports was the worst seen since May. It now looks like the important net exports contribution to Q4 Australian GDP will be much weaker than Q3. If this trend continues, Australian activity data looks set to deteriorate at a rapid pace in 1H 2016. There is plenty more downside to the AUD from its current US$0.70 level.
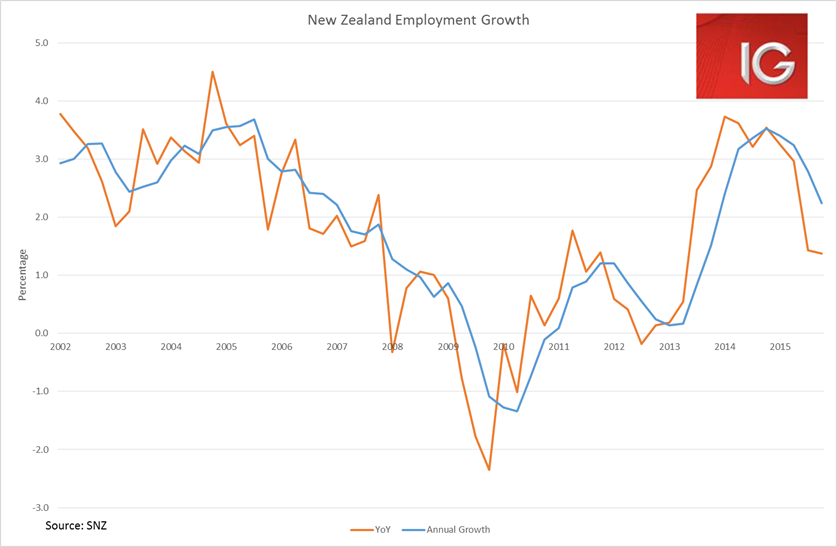
The kiwi dollar had a boost today after Q4 employment growth came in much stronger than expected, and to further solidify its gains, RBNZ governor Graeme Wheeler took a far more hawkish tone in his speech today than was evident in the most recent RBNZ statement. The New Zealand unemployment rate fell to its lowest level since Q1 2009 but the vagaries of quarterly data do seem to be hiding far weaker numbers. For one, Statistics NZ noted that a large amount of the workforce retired, improving the unemployment rate substantially, and the vast bulk of new jobs in the quarter were volatile part-time jobs (+2.5% QoQ).
But the trend in full-time and total jobs is still pointing to further weakness. Nonetheless, in the wake of Wheeler’s speech a rate cut by the RBNZ at their March meeting does not look like a done deal just yet. Selling into the NZD bounce today still looks like the best bet.
Trade idea - Play falling oil through long USD/CAD positions – Chris Weston
Take your pick of the following macro concerns: 1) Rapid moves in oil 2) Huge capital outflows from China resulting in a tightening of financial conditions 3) A rising USD putting stress on commodities and emerging markets (specifically the corporate sector). Last night’s risk off theme was oil driven and without going into depth about the fundamental reasons (read Evan’s write up here), the technicals have clearly broken down strongly too. I’ll flag these below and would be playing this through long USD/CAD positions.
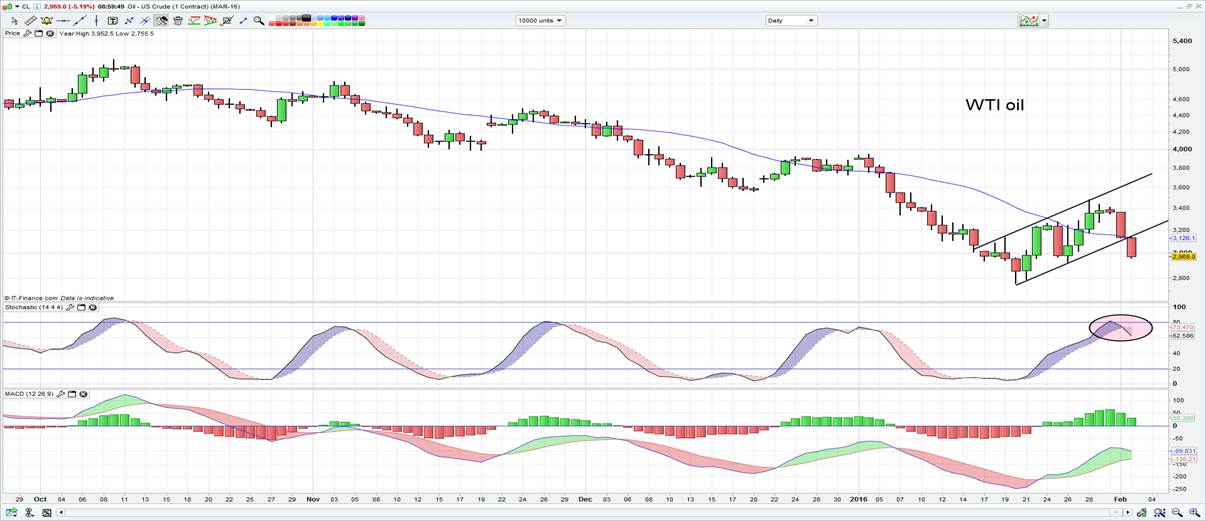
As we can see from the top chart, US crude has completed a bear flag pattern (as seen by trend support giving way) and one would now expect a move into the recent low of $27.56 (March contract). Momentum (as seen in the stochastic oscillator) has turned lower (circled in the middle pane) and given off a bearish signal. Short oil in itself looks compelling, albeit a brave trade given the volatilty and one questions how markets will react if we see a break of the 20 January low.
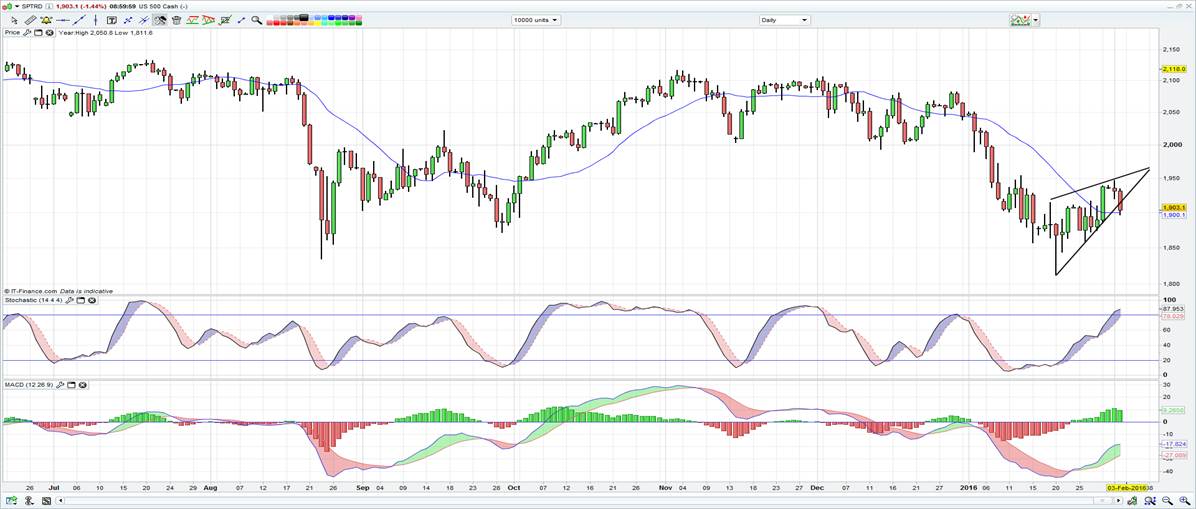
As we can see from the S&P 500 a similar move has taken place, with uptrend support having been breached. This is naturally bearish, although I would ideally like to see momentum rollover and give more conviction to short positions. Still, the balance of probabilty suggests 1950 (in the index) could be a short-term high.
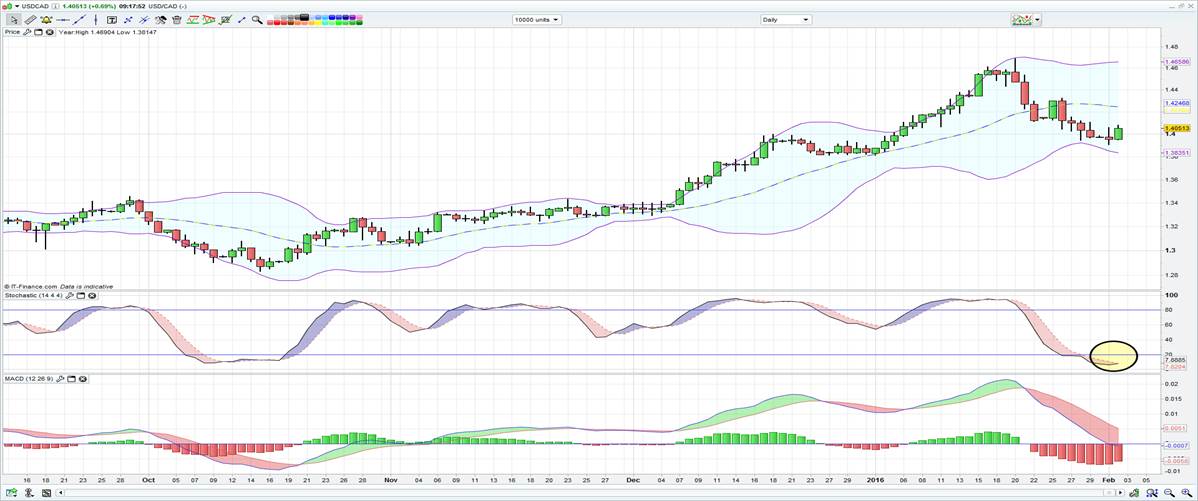
Playing a falling oil price is easily done through the forex market and specifcally I like being long USD/CAD. I like the idea of being long with a stop below the lower Bollinger band at $1.3835, for a move into the 20-day average of $1.4246 and potentially higher. We are starting to see momentum base and is looking to turn higher which should provide further confidence to the trade, but until that point I would keep position sizing low.
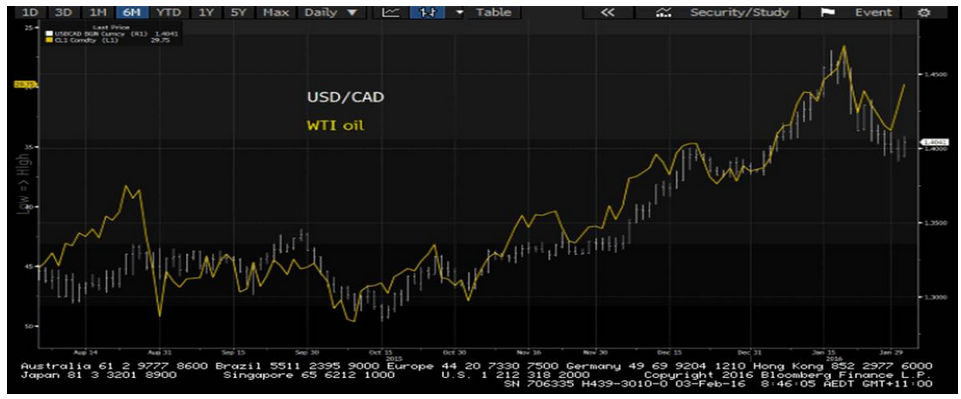
If I map the oil price to USD/CAD (I have inverted/flipped USD/CAD to show a better correlation), we can see that USD/CAD has been left behind by the falls in oil. If the pair plays catch up then we could see USD/CAD move into the $1.4400 region. Another factor giving me confidence.
