by Pinchas Cohen
Yesterday’s equity rally—which took the S&P 500 and NASDAQ to new record high closes for each—is showing signs of fading, even as oil continues to extend its gains. While Japanese stocks opened with a rising gap, there was not enough demand to support the up trend; they fell back toward yesterday’s closing prices. However, after a lull they once again pushed through and as of this writing are continuing the rally.
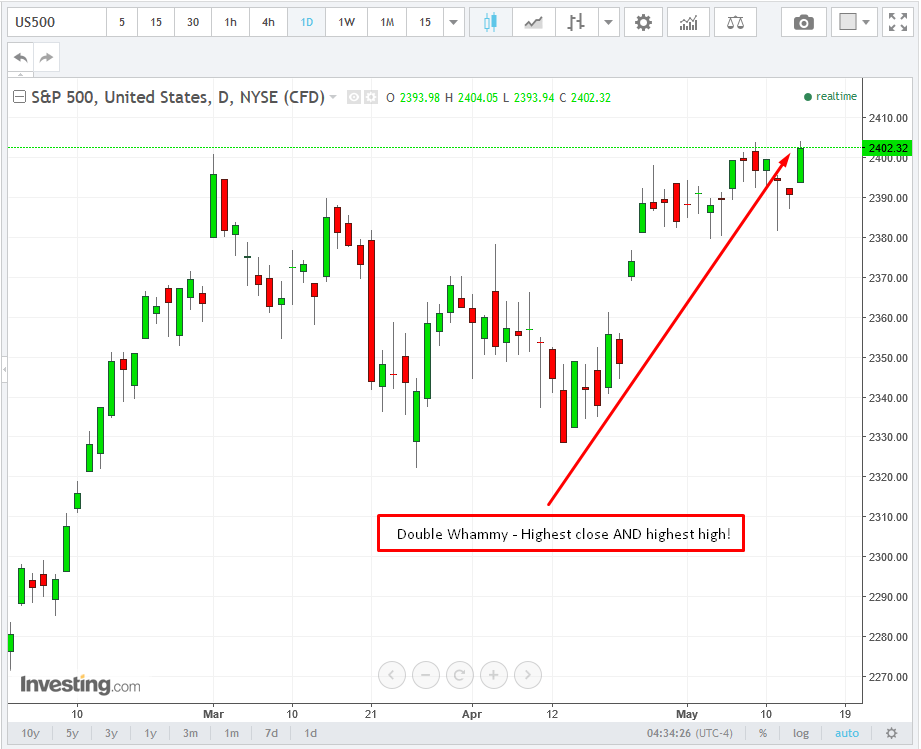
Currently, Asian, US and UK markets continue to rally as EU markets sit this one out.
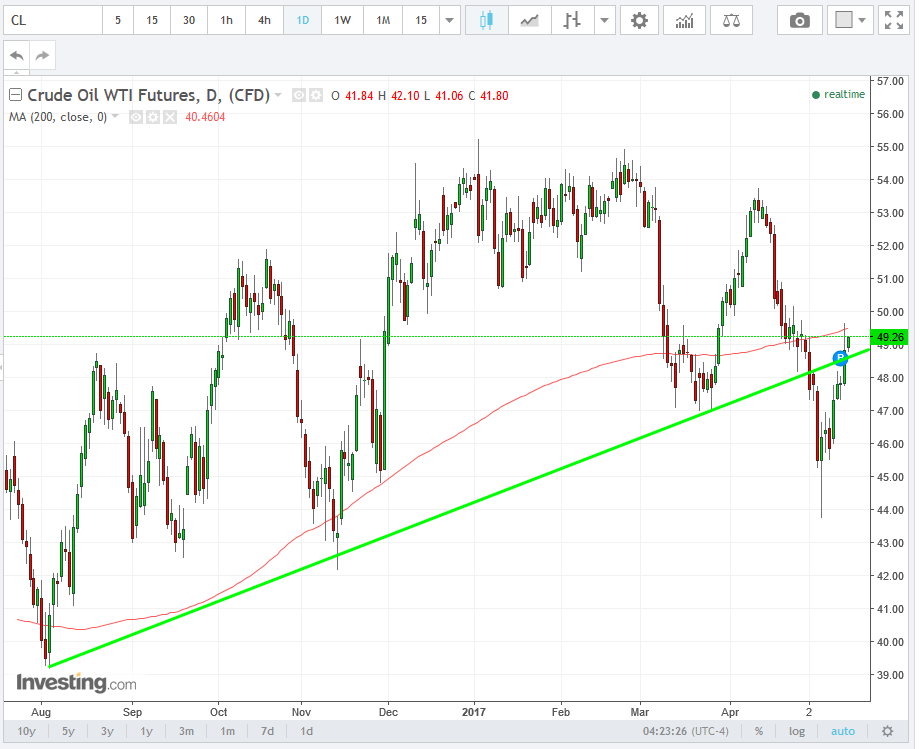
Crude oil crossed over $49—as well as its 200dma—yesterday and reached the better part of $50 a barrel. However, despite the sudden global enthusiasm for the volatile commodity on the prospects of extended production cuts led by Saudi Arabia and Russia, oil pared some of its gains to close below $49, and the 200dma.
Today, crude extended gains, advancing for the fifth straight day on the hope that other oil producers might join in the extended cuts. Oil is back above $49, but as of 3:00 EDT, still beneath the 200dma. A weakening dollar should boost both oil and equities.
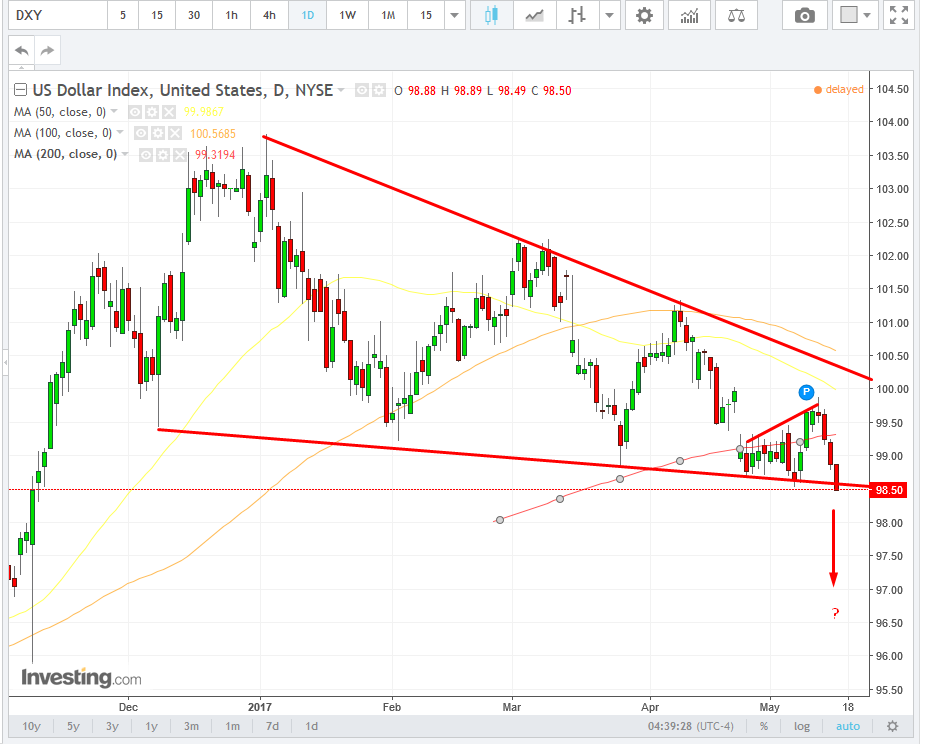
The Dollar Index is free-falling for a fourth consecutive day, heading toward its May low, its lowest point since November. Concurrently, gold is rising for a fourth straight day.
Today's downward driver for the USD is the news that President Donald Trump shared classified information with the Russians. This political scandal comes on top of Trump’s firing of FBI director Comey late last week. All of which is putting into question his ability to deliver on his economic agenda.
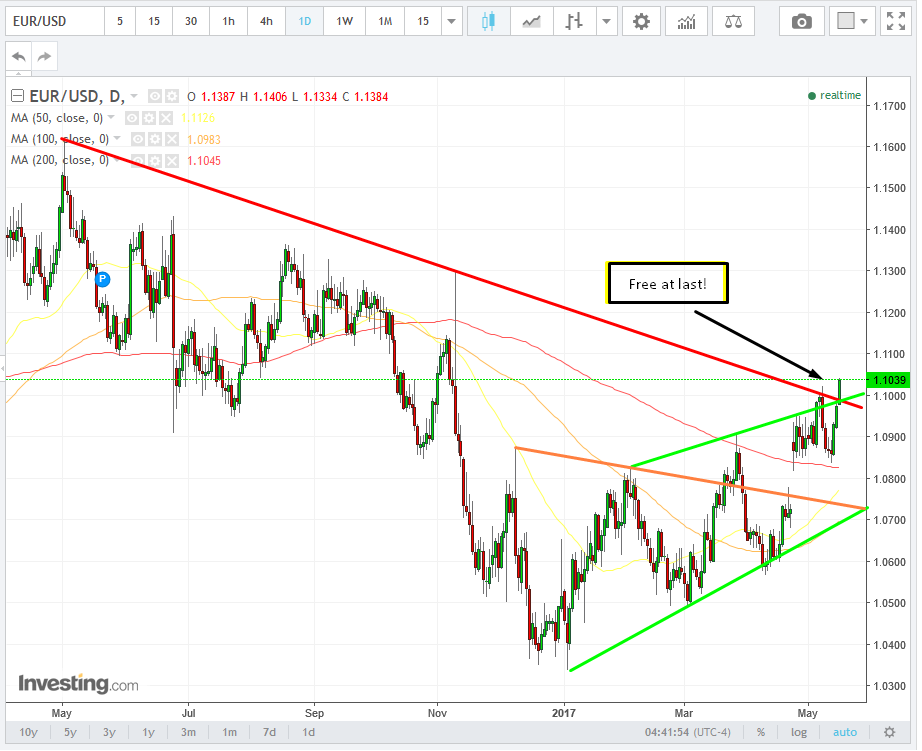
In response to the dollar's decline, the euro leaped, breaking through its trading pattern since April 24 and blowing out what may have proved to be a H&S reversal.
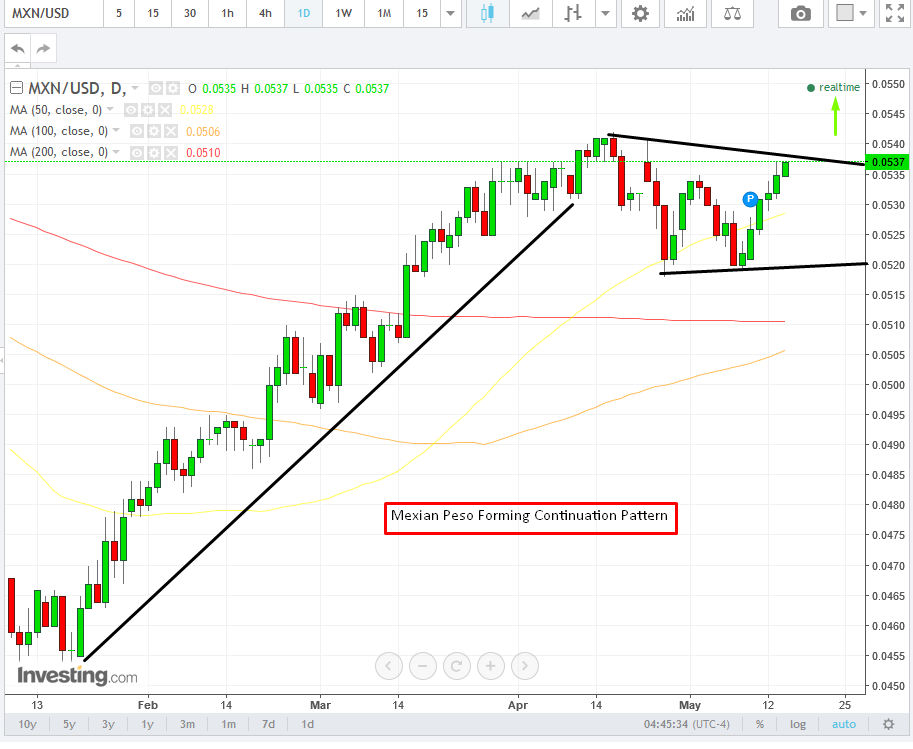
The Mexican peso—aka the anti-Trump trade—is gaining, moving higher for its sixth straight day.
The yen pared yesterday’s losses but remains beneath the broken uptrend line and the 50dma. It's poised for another decline.
On May 7, South Korea's KOSPI recorded a new record high. This was also the final trading day prior to the country's presidential elections on May 9. After liberal candidate Moon Jae-in won, the KOSPI pared half its gains.
Possibly, this occurred because Moon, the first liberal voted into office in a decade, prefers to improve relations with North Korea over the existing relationship with the US. On the other hand, he was open about this throughout the campaign and nevertheless had a 20 percent lead over his opponents. The sell-off may therefore have been a knee-jerk reaction by traders about the uncertainty in light of North Korea's recent missile testing. Nevertheless, yesterday the KOSPI closed at the pre-sell-off level.
At the same time, the South Korean won plunged over 0.35% percent with a breakaway gap from the trading pattern it's been in since April, extending its decline to .66% of a percent. A weakening won should boost South Korean equities.
Global exchanges made records this week, once more finding their animal spirits despite Trump, most likely receiving a lift from China’s massive plan to boost global infrastructure spending. The surge in oil helped ignite further the animal spirits, despite recent concerns regarding the strength of the global economy, after Chinese industrial production and retail data disappointed on Monday, on the heels of US retail sales and inflation which came in weaker, as well.
Here’s what investors will be keeping an eye on today:
- Gross domestic product figures for the eurozone came in at 1.3%, while the prior read was 3.0%
- U.K. inflation data, grew almost across the board.
- Germany’s ZEW confidence gauge surprised to the downside.
- U.S. Housing Starts (8:30) growth is expected to have risen 3.7% after the previous drop of 6.8%, but the most important U.S. data point will be industrial production, which will provide useful insight into how the manufacturing sector is performing, particularly now that auto sales appear to have peaked for the cycle. Output is expected to have declined from 0.5% to 0.4% growth.
- The IEA comes out with estimates of April OPEC production. As opposed to Goldman Sachs, the IEA says extending production cuts isn’t likely to reduce global oil inventories.
Today's Main Financial Market Movers:
Currencies
- The Dollar Index fell 0.35% to 98.55, its fourth consecutive decline, for a total loss of 1.10%.
- The euro climbed 0.5 percent to $1.1028, the highest it's been since November 9, the day after the US election.
- The yen rose 0.3 percent to 113.47 after dropping 0.4 percent Monday.
- The South Korean won increased 0.7 percent to its highest since April 3.
- The Mexican peso added 0.4 percent.
Commodities
- Oil added 0.5 percent to $49.11 a barrel, after surging 2.1 percent Monday. Crude is up for a fifth day, its longest winning streak in more than a month.
- Gold rose 0.3 percent to $1,234.89 an ounce, up for a fourth session.
Stocks
- The MSCI Asia Pacific Index added 0.2 percent to reach the highest level seen in almost two years.
- Japan’s Topix rose 0.3 percent, paring an earlier gain of 0.7 percent. The Nikkei 225 Stock Average climbed to as high as 19,998.49 before pulling back. India’s Sensex rose 0.5 percent to a record.
- China shares traded in Hong Kong retreated 0.3 percent after surging 1.6 percent Monday amid optimism over Beijing’s infrastructure spending program. The Shanghai Composite Index increased 0.7 percent, erasing an earlier loss. The Shenzhen Composite surged 2.1 percent, the most since August.
- The Stoxx Europe 600 fell 0.1%.
- S&P 500 Futures were little changed after the benchmark gauge advanced 0.5 percent Monday.
Home Depot (NYSE:HD) reports Q1 2017 results before the market opens today.
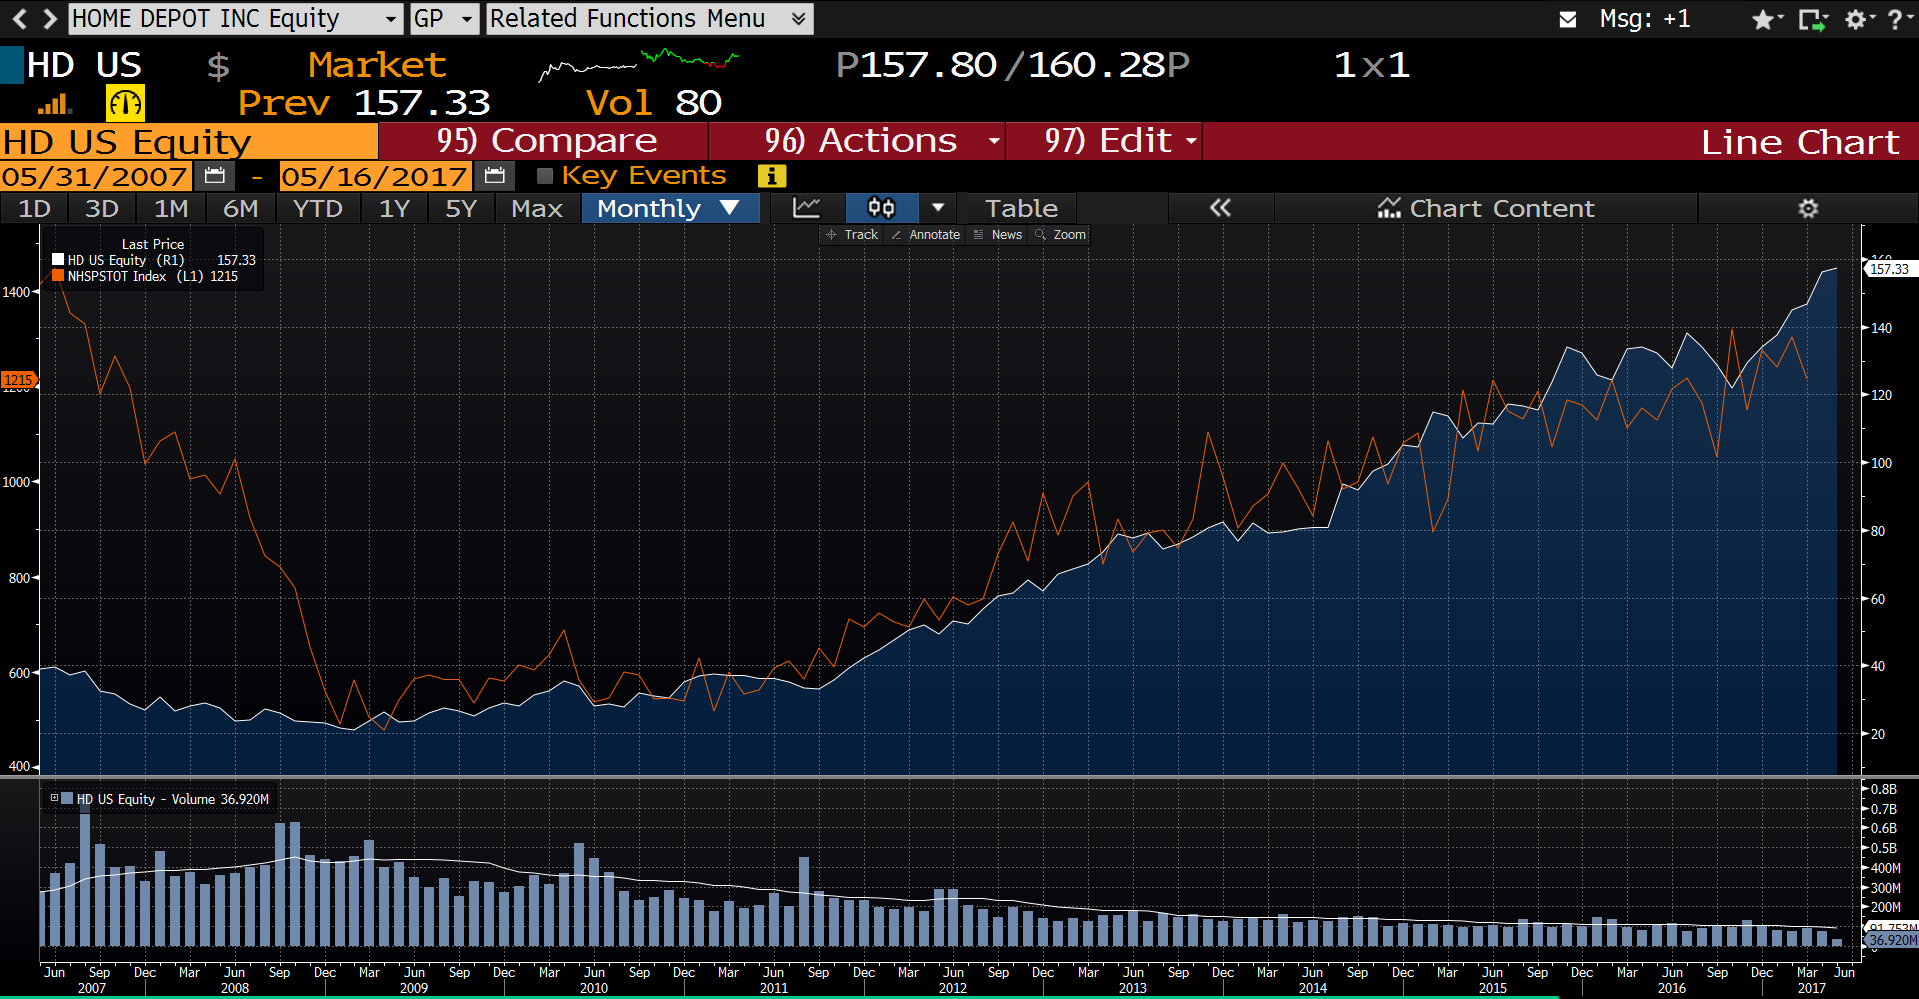
1Q same-store sales likely beat estimates of 4.3%, driven by ongoing strength in big-ticket items such as building materials. A rebound in April retail sales for the category, up 1.2% from March and 9.3% from the prior year, suggests that consumers continue to invest in their homes, and likely offsets any slowdown in appliance sales, as suggested by the Association of Home Appliance Manufacturers March data. EPS growth will be supported by an $15 billion buyback authorization, and tight cost control.
Bonds
- The yield on 10-year Treasuries fell less than one basis point to 2.34 percent, after climbing two basis points Monday.
