Get 40% Off
👀 👁 🧿 All eyes on Biogen, up +4,56% after posting earnings. Our AI picked it in March 2024.
Which stocks will surge next?
Unlock AI-picked Stocks

Modest Selling When Worse Was Expected

Published 07/07/2015, 12:53 AM
Updated 07/09/2023, 06:31 AM

Hard to say if bears have had enough or are just waiting for worse news to follow, but the Greek referendum didn't have too much of an impact on Monday's action after the long weekend.

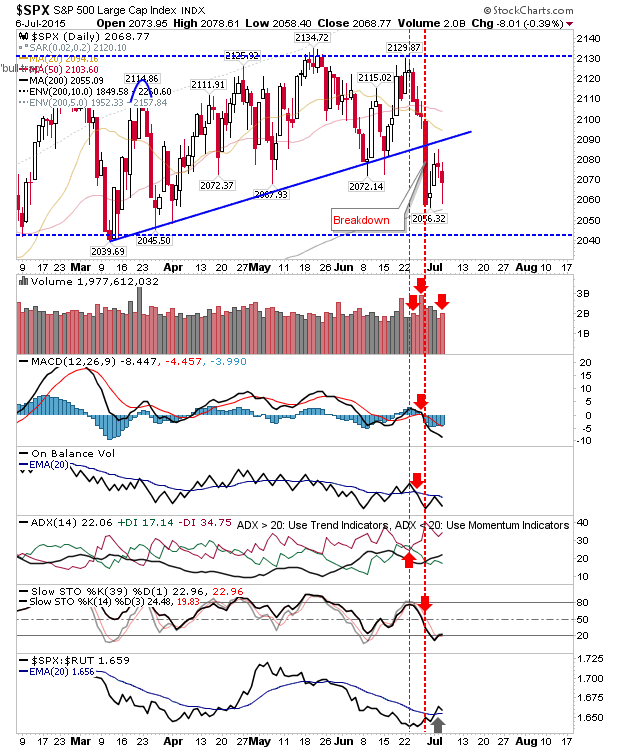
In the case of the S&P, early losses didn't go as far as to tag the 200-day MA, but the 200-day MA has played as support. Technicals remain next bearish, and the swing low at 2,039 is calling. Volume climbed to register net bearishness, although there is a relative loss in performance against the Russell 2000.

SPX Daily Chart

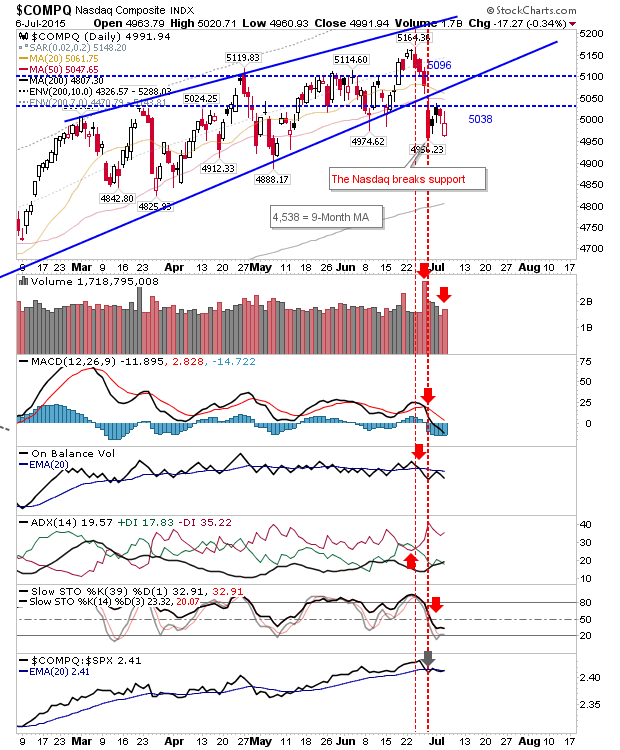
The Nasdaq continues to consolidate below 5,038. Higher volume distribution plays the bearish tune, and technicals are net bearish. The 200-day MA remains a tasty proposition to the downside.

Nasdaq Composite


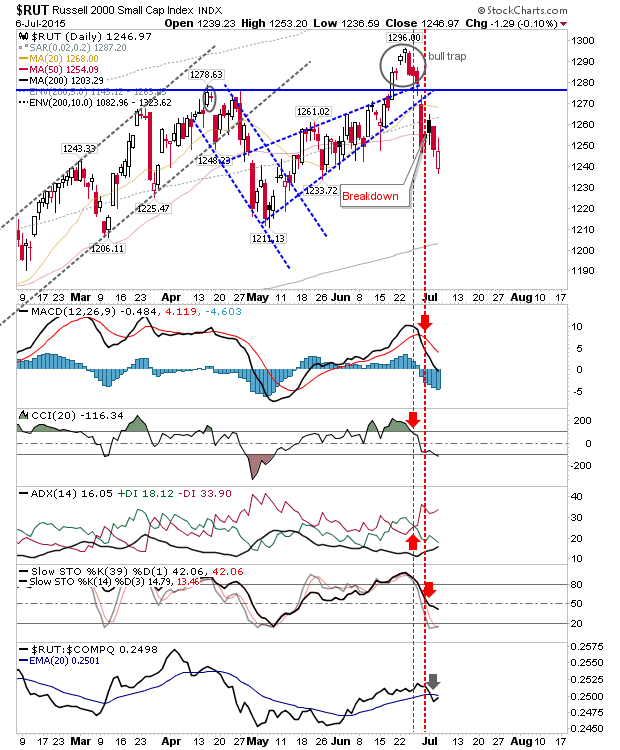
The Russell 2000 opened at new lows and closed near Friday's close in a decent recovery. The June 'bull trap' is still the dominant pattern, and unless it breaks above 1,279 and starts pressuring this supply, then bears still hold primary control.

Russell 2000 Daily Chart


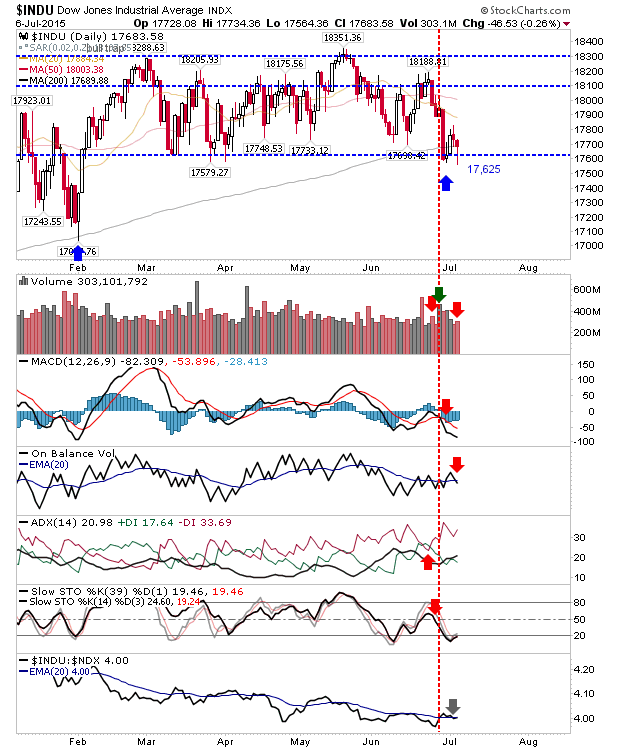
The Dow is pushing the 200-day MA more so than the S&P. It started below this moving average, but managed to do enough to regain it by the close. The index managed a successful test of this moving average at February, and is working again on one for June.

Dow Daily Chart


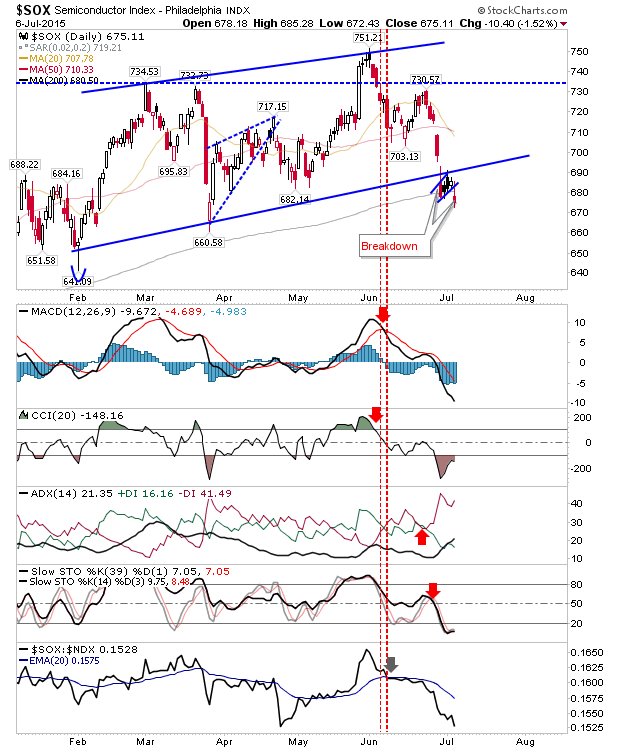
The Semiconductor Index pushed a break of the 200-day MA after dropping out of its upward channel. Last week's action at the 200-day MA formed a 'bear flag', with today a follow through breakdown (of the breakdown). The loss of the 200-day MA adds to the bearish tone (as do the net bearish technicals).

3rd party Ad. Not an offer or recommendation by Investing.com. See disclosure here or remove ads .

SOX Daily Chart


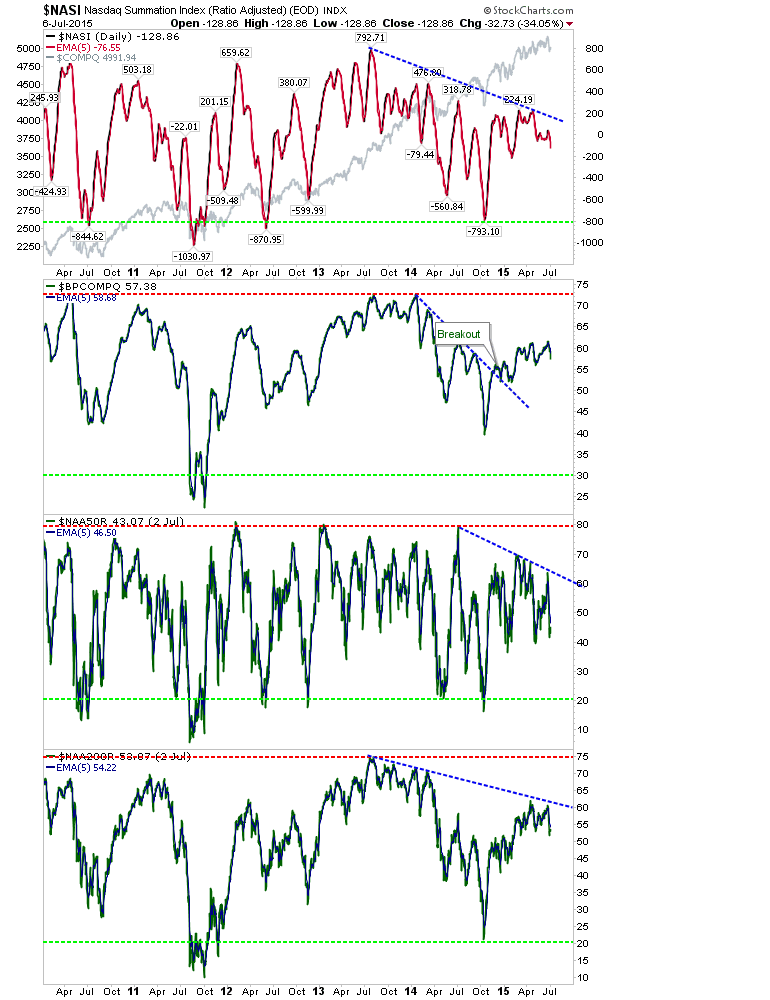
Nasdaq Breadth continues to map bearish divergences, although there is no reason resistance can't break higher, adding fuel to the existing rally. On the flip side, Nasdaq breadth remains well off oversold conditions; conditions last visited in 2011. Markets came close to complete oversold conditions in 2014, but rallied before things truly capitulated.

NASI Daily Chart


Results in the Greek Referendum are not the end of the story, and each snippet of news will play its own role. The next big shock is set for July 20th, but smaller shocks are likely on the way. I would be more comfortable with another 2011 (or 2009) washout, but it's not coming easy.

Latest comments

Risk Disclosure: Trading in financial instruments and/or cryptocurrencies involves high risks including the risk of losing some, or all, of your investment amount, and may not be suitable for all investors. Prices of cryptocurrencies are extremely volatile and may be affected by external factors such as financial, regulatory or political events. Trading on margin increases the financial risks.
Before deciding to trade in financial instrument or cryptocurrencies you should be fully informed of the risks and costs associated with trading the financial markets, carefully consider your investment objectives, level of experience, and risk appetite, and seek professional advice where needed.
Fusion Media would like to remind you that the data contained in this website is not necessarily real-time nor accurate. The data and prices on the website are not necessarily provided by any market or exchange, but may be provided by market makers, and so prices may not be accurate and may differ from the actual price at any given market, meaning prices are indicative and not appropriate for trading purposes. Fusion Media and any provider of the data contained in this website will not accept liability for any loss or damage as a result of your trading, or your reliance on the information contained within this website.
It is prohibited to use, store, reproduce, display, modify, transmit or distribute the data contained in this website without the explicit prior written permission of Fusion Media and/or the data provider. All intellectual property rights are reserved by the providers and/or the exchange providing the data contained in this website.
Fusion Media may be compensated by the advertisers that appear on the website, based on your interaction with the advertisements or advertisers.
© 2007-2024 - Fusion Media Limited. All Rights Reserved.