Stocks in Energy Master Limited Partnerships (MLPs) have experienced some of the worst declines of any sector this year. The below chart of the Credit Suisse (VX:CSGN) X-Links Cushings MLP Infrastructure ETN (N:MLPN) is a clear example of the magnitude of the decline. From the ETNs high to its low this year, the ETN fell over 52%. In less than a month, and mostly the past week, MLPN has rebounded 19% yet remains 43% below its 52-week high.
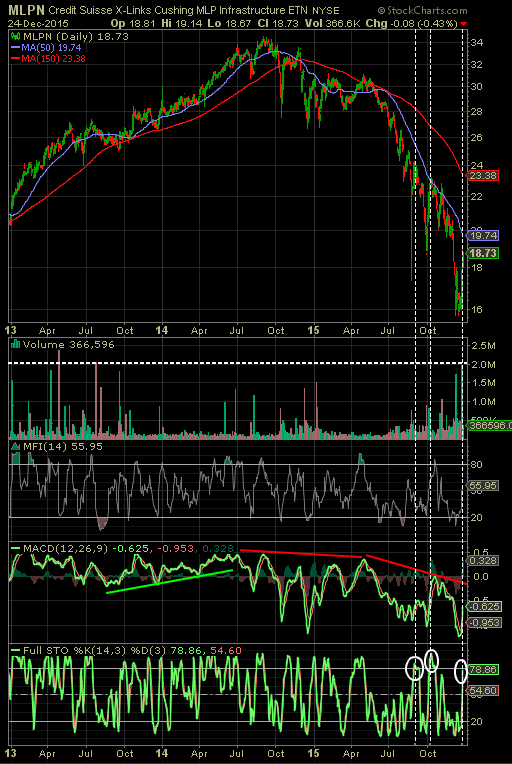
Given the magnitude of the decline in MLPs, investors are evaluating whether this is an opportunity to begin building positions in the asset class. One decision point revolves around technicals while the other is centered in evaluating the fundamentals of many MLPs themselves. Technically, the recent bounce in some MLPs is placing them near short term overbought levels. In my view it will be the fundamentals that drive the future long term returns of the asset class and it is here where the waters become a little murky.
The growth of shale fracking has been a game changer for the natural gas and overall energy market in the U.S. The over supplied levels for both gas and oil has been written about ad nauseum this year, but suffice it to say the U.S. has abundant supplies of energy resources in the near term.
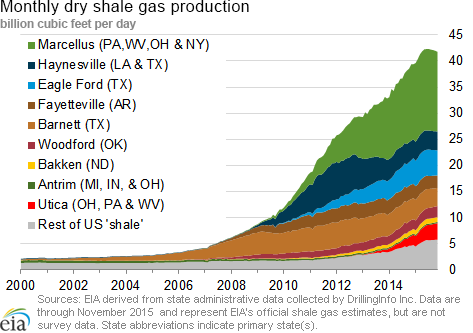
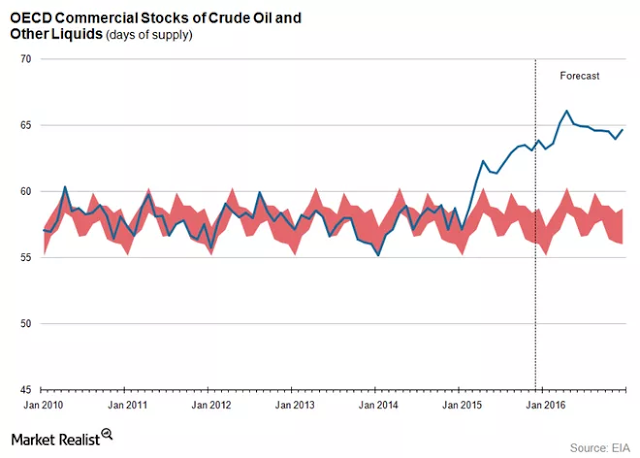
The consequence for exploration and production (E&P) MLPs is the increased supply is resulting in lower prices for their product, thus pressuring margins. Historically, the safe plays in MLPs were the midstream companies that essentially transported the product from the well head and then paid a toll based on the volume of oil/gas transported through their pipelines. Therein lies one question, if the E&P companies produce less, will less be transported by midstream MLPs, thus negatively impacting the revenue of the midstream MLPs?
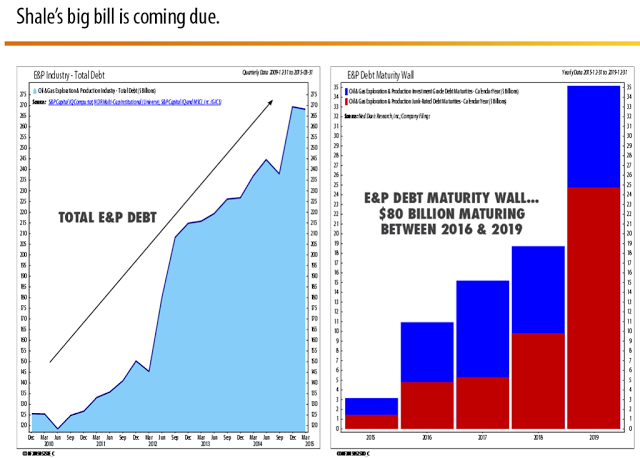
Two additional issues are facing MLPs broadly that are related. As noted above a part of MLP growth has come from the booming natural gas segment, largely a result of shale fracking. In order to handle the growth, MLPs have increased their capital expenditure budgets and financed the expenditures via both equity and debt funding sources. This has occurred at the same time MLPs have strived to grow their distributions to shareholders.
Given the challenges facing many of the E&P MLPs, a few have cut distributions in order to funnel cash flow to capital expenditures due to the inability to access the credit markets without facing potential credit rating downgrades. Additionally, some of these MLPs have resisted issuing equity at these lower stock price levels due to the increased dilutive impact to existing shareholders. Also, the E&P companies will be facing an increasing need to roll over maturing debt.
In reviewing the fundamentals then, one common measure used to evaluate MLPs is the debt to EBITDA ratio. In a 2013 Barron's article, Ned Davis Research opined,
“the debt-to-EBITDA ratio of the Alerian MLP Index goes a long way towards explaining returns. When the median stock in the index trades above 2.6 debt-to-EBITDA, MLPs have lost 10% on average. When it’s been below 2.6, they’ve gained 20%...”
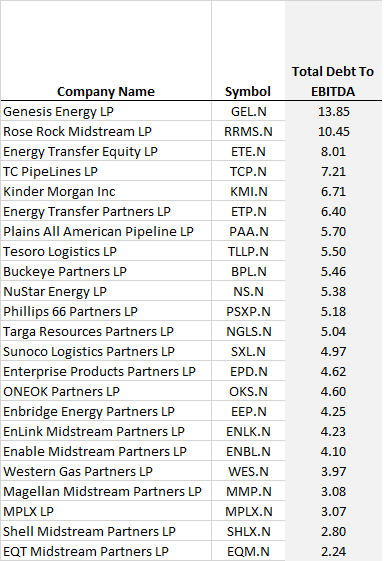
One midstream oriented MLP index is the Cushing MLP Infrastructure Index and all but one MLP in that index has a debt to EBITDA ratio greater than 2.6. Half of the MLPs have debt/EBITDA ratios greater than 5.0 and several are double digits.
The next question is what level of financing will be needed going forward to fund growth? The above file contains detail on cash flow from operations versus capital expenditures. In total, the gap that needed to be funded in 2015 with debt or equity is in excess of $11 billion. I also included a more detailed quarterly cash flow report for Energy Transfer Partners (N:ETP) in order to provide readers with insight into the funding sources and uses of cash by the company. A number of midstream MLPs have similar funding source breakdowns between equity and debt issuance.
As noted earlier in this post, debt is likely to be a more restrictive funding source, so equity is the alternative. With MLP prices depressed, MLPs are less likely to issue equity due to the level of dilution. The alternative is to cut cap ex, cut the dividend or a combination of the two. Given the market’s negative reaction to recent distribution cuts by several MLPs, managements at MLP companies are likely to take a harder look before cutting distributions and more likely focus on cap ex first. Cutting capital expenditures has the potential negative impact of constraining future growth; however, this is likely what is needed given the U.S. energy glut.
