Forex News and Events:
The G10 majors are mostly driven by economic data this week. Good news from Australia and Japan are followed by subdued GDP growth out of the Euro-zone. EUR-crosses remain at risk given dovish ECB expectations on June 5 meeting, EUR/USD resistance remains solid at 200-dma. The day continues with ADP employment report out of the US and Bank of Canada policy decision. The Loonie extends weakness towards 50-dma versus USD, the sentiment leans towards a softer CAD. In Turkey, the lira is heavily offered on high political tensions and questionable central bank independence from AKP’s ruling government. Some interesting statements are on the menu of today’s news.
The Loonie offered pre-BoC
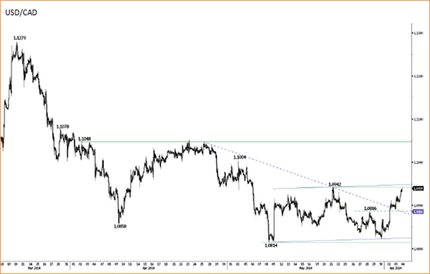
The BoC will give policy verdict today and is broadly expected to keep the status quo. We expect the official neutral tone to remain (with subdued yet obvious easing bias) and believe that the latest rise in headline inflation (to 2% y/y) is nothing but temporary given the subdued acceleration in GDP growth. Such deviations do not, in our view, constitute a strong base for any policy action. This said, the CAD-bears are still reluctant to jump on the short-side of the play. May 27 CFTC data shows further reduction in short future positions in CAD; the short contracts retreated to November 2013 lows.
USD/CAD tests the 50-dma (1.0945) pre-BoC, the bullish trend gains traction. We continue keeping our USD/CAD bullish view as long as 1.0804 Fibonacci support holds (38.2% retracement on 2009-2011 drop). Large option expiries due today are likely to keep the downside limited at 1.0900/25. In case of reversal, option related offers abound below 1.0855. At this stage, we note that the USD leg is also closely monitored. The ADP employment report (at 12:15 GMT) and Friday’s NFPs (both expected softer than last month’s positive surprise) should cap USD rallies. The short-term supply zone is seen at 1.1000/13 (optionality & 100-dma).
Corner of interesting news: Turkey
According to a Turkish pro-government news agency Sabah, the PM Erdogan would have given the CBT Governor Basci three months to taper inflation amid the core inflation hit 9.66% in May. Unsatisfied with central bank’s tighter policy view to control price dynamics, PM Erdogan would suggest lower rates as necessary to avoid price jumps. Although the statement is counter-intuitive according to classical economic theories, a new wave of thinking, called “neo-Fisherite rebellion”, would interestingly support such theory. According to neo-Fisherites, the low interest rates would trigger deflation. The latter idea is very similar to what we used to call a “liquidity trap” experienced by Japan in 1990’s, and perhaps Euro-zone nowadays. Yet we note that the economic characteristics of these developed markets are significantly different from today’s Turkey, undoubtedly labeled as “emerging market”. This said, we do not believe that an emerging economy (subject to classical economic pressures) is concerned about the newborn alternative theories.
We remind that the Central Bank of Turkey unexpectedly cut the policy rate from 10.00% to 9.50% at May 22 MPC meeting despite increasing inflationary pressures. The overnight borrowing and lending corridor remains stable at 8.00%-12.00% - some side flexibility that CBT could save for itself. Turkish lira lost more than four figures against USD since rate cut decision. With rising political risks and questionable independence of the CBT, we remain highly cautious regarding TRY and TRY holdings.
USD/TRY remains offered today. The pair hits 2.1277 for the first time since April 29. The bullish trend gains momentum, a significant break above 2.1320 will send USD/TRY back into its broad uptrend channel band (building since May 2013). On the option markets, the barriers are mostly cleared now, bids are building above 2.1200. On a similar pattern, EUR/TRY broke the 200-dma (2.8730) on the upside. While the cross is subject to EUR-risk (ECB meeting on June 5), the upside trend should gain traction if 200-dma holds tight.

Today's Key Issues (time in GMT):
2014-06-04T11:00:00 USD May 30th MBA Mortgage Applications, last -1.20%2014-06-04T12:15:00 USD May ADP Employment Change, exp 210K, last 220K
2014-06-04T12:30:00 CAD Apr Int'l Merchandise Trade, exp 0.10B, last 0.08B
2014-06-04T12:30:00 USD Apr Trade Balance, exp -$40.8B, last -$40.4B
2014-06-04T12:30:00 USD 1Q F Nonfarm Productivity, exp -3.00%, last -1.70%
2014-06-04T12:30:00 USD 1Q F Unit Labor Costs, exp 5.30%, last 4.20%
2014-06-04T13:45:00 USD May F Markit US Services PMI, exp 58.2, last 58.4
2014-06-04T13:45:00 USD May F Markit US Composite PMI, last 58.6
2014-06-04T14:00:00 CAD Bank of Canada Rate Decision, exp 1.00%, last 1.00%
2014-06-04T14:00:00 USD May ISM Non-Manf. Composite, exp 55.5, last 55.2
2014-06-04T18:00:00 USD U.S. Federal Reserve Releases Beige Book
The Risk Today:
EUR/USD
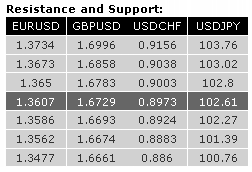
EUR/USD failed to break the resistance at 1.3650 (27/05/2014 high, see also the declining trendline) yesterday, indicating persistent selling pressures. Supports stand at 1.3586 and 1.3562 (12/02/2014 low). Another resistance lies at 1.3734 (19/05/2014 high). In the longer term, the break of the long-term rising wedge (see also the support at 1.3673) indicates a clear deterioration of the technical structure. The long-term downside risk implied by the double-top formation is 1.3379. Key supports can be found at 1.3477 (03/02/2014 low) and 1.3296 (07/11/2013 low).
GBP/USD
GBP/USD is moving within a declining channel. The failure to break the hourly resistance at 1.6783 (27/05/2014 low) suggests a weak buying interest. An hourly support lies at 1.6693 (29/05/2014 low), while a key support stands at 1.6661. Another resistance is given by the declining channel (around 1.6858). In the longer term, despite the break of the long-term rising channel, the lack of significant bearish reversal pattern suggests a limited downside risk. Indeed, the current weakness looks like a classic "zig-zag" (or A-B-C) correction. As a result, a medium-term bullish bias remains favoured as long as the support at 1.6661 (15/04/2014 low) holds. A major resistance stands at 1.7043 (05/08/2009 high).
USD/JPY continues to improve However, prices are now short-term overextended and close to the resistance at 103.02. Hourly supports can be found at 102.27 (03/06/2014 low) and 101.76 (02/06/2014 low, see also the rising channel). A long-term bullish bias is favoured as long as the key support 99.57 (19/11/2013 low) holds. Monitor the support area provided by the 200 day moving average (around 101.39) and 100.76 (04/02/2014 low). A major resistance stands at 110.66 (15/08/2008 high). We have raised the stop-loss of our remaining long position.
USD/CHF continues to challenge the resistance implied by the 200 day moving average (around 0.8985). Another resistance can be found at 0.9038 (12/02/2014 high). A short-term bullish bias is favoured as long as the support at 0.8924 (22/05/2014 low) holds. Another support stands at 0.8883 (15/05/2014 low). From a longer term perspective, the bullish breakout of the key resistance at 0.8953 suggests the end of the large corrective phase that started in July 2012. The long-term upside potential implied by the double-bottom formation is 0.9207. A key resistance stands at 0.9156 (21/01/2014 high).

