The bearish scenarios of a similar or worse stock market crisis than the one we lived in 2008-2009 are now emerging again. The sharp drop in the Chinese stock market combined with the possibility of an exit from the Eurozone for Greece and its repercussions, are the major fears and risk aversion reasons for traders around the globe. The DAX index has already lost nearly 15%, IBEX lost nearly 13%, MIB lost 13%, EUSTOXX lost -13% since last April. More optimistic analysts believe that this is just a big correction following the rally that worldwide indices made since October 2014, and also believe that once the Greeks come to an agreement with their lenders, the market will normalize and resume its longer-term up trend.
I will try and look at this from a technical stand point, as objectively as I can. European indices have made an important top in April. So a break above this top will be a huge bullish signal. Trend is bearish for the short and medium-term, while the longer-term trend is now being challenged.
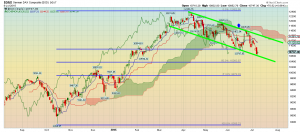
So what is common among all these indices? The decline in all indices is not impulsive. The price action among all major indices is of an overlapping nature, thus corrective. All indices are around important Fibonacci ratios relative to the rise from October 2014. DAX is near its 38% retracement.
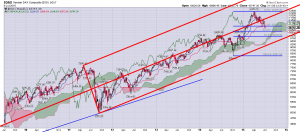
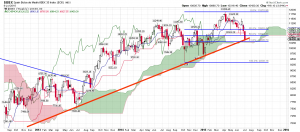
IBEX has reached the 61.8% retracement and the red long-term trend line support in its weekly chart, as shown below.
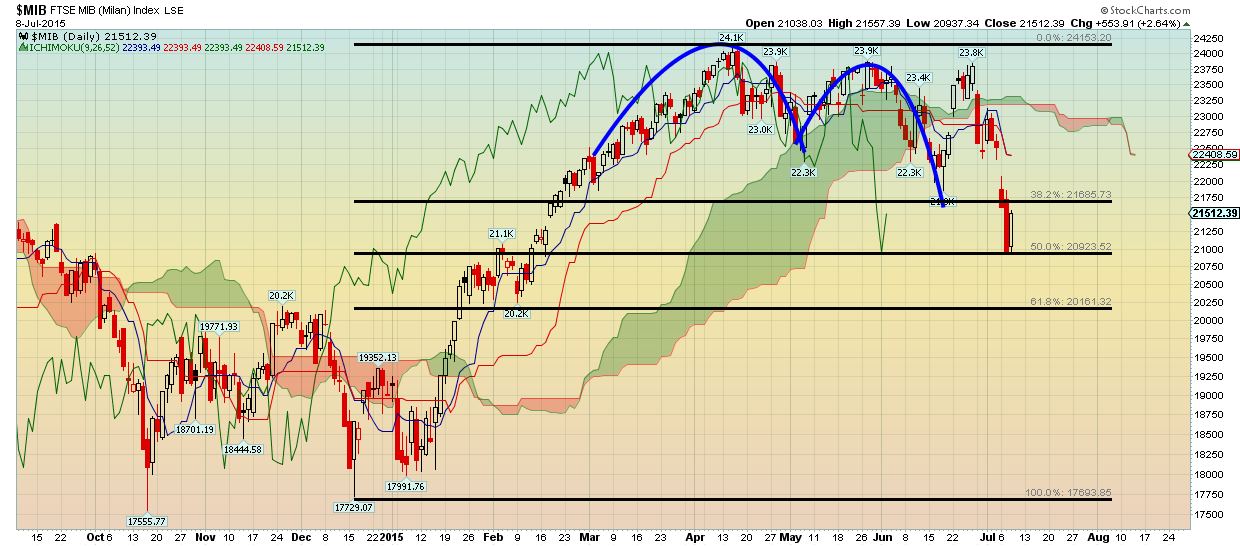
MIB has reached the 50% retracement of the rise from 17730 to 24100. Clearly, a corrective wave pattern with lots of overlapping waves.
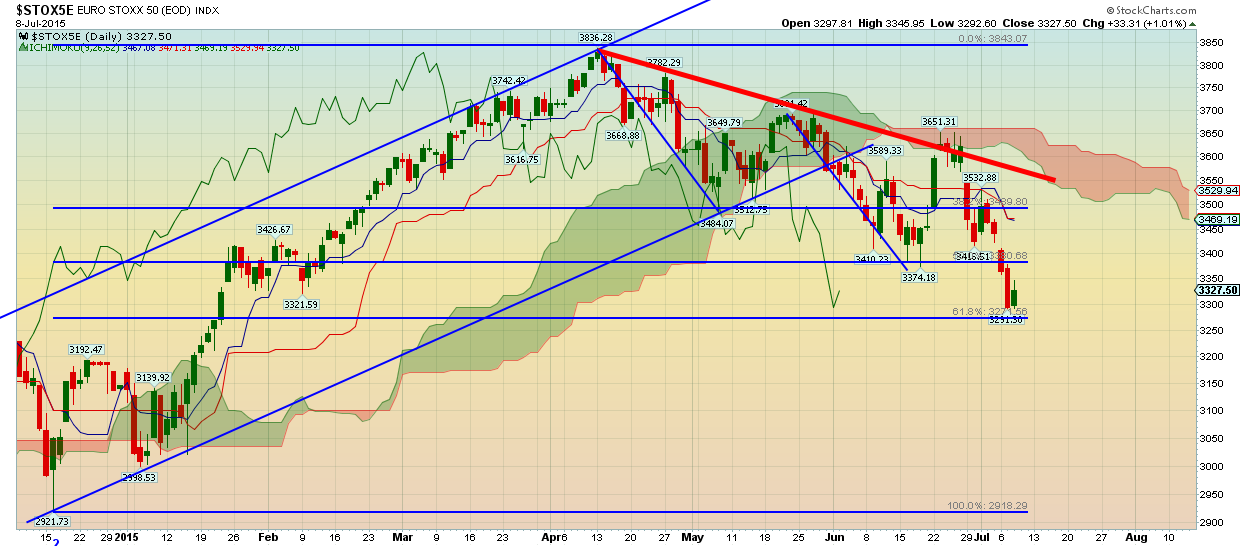
EUSTOXX has reached the 61.8% Fibonacci retracement, with also an overlapping wave structure.
FTSE100 has reached the 61.8% retracement and the long-term red trend line support.
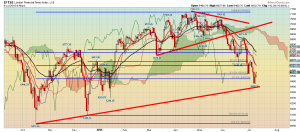
Trend remains bearish for the short-term for all indices. All of them show signs of short-term trend reversal after reaching their important support levels, whether it is 38% or 61.8% retracement. Another bearish sign for all indices is the fact that they all remain below their Ichimoku clouds.
So should we fear for the worst? I do not believe so. I believe that we are in a corrective process and we should soon see some reversal signals. The bull market is far from being over, despite all the talks about GREXIT in Europe…my belief is that this is not gonna happen. However, my strategy is not to go all in right now.
Disclosure: None of the information or opinions expressed in this blog constitutes a solicitation for the purchase or sale of any security or other instrument. Nothing in this article constitutes investment advice, and any recommendations that may be contained herein have not been based upon a consideration of the investment objectives, financial situation or particular needs of any specific recipient. Any purchase or sale activity in any securities or other instrument should be based upon your own analysis and conclusions.
