
I have always found that the time when I have learned the most about an investment process is when it does not perform well. After all, it is during periods of drawdown that the blemishes that appear in a model and no amount of backtesting will warn you of those shortcomings. If you are willing to learn from periods of underperformance, you can, in effect, make your first loss be your best loss. This is a case study of how I learned to diagnose a model`s shortcomings and learn from that experience.
Trend Model underperforming
My Trend Model has seen some stellar returns for the past 18 months (last report card here), but had experienced some spotty performance in the past few months. While the returns were not disastrous, they were not up to the levels seen in earlier periods. A look at buy and sell signals in 2015 show a pattern of market choppiness and signal whipsaw:

In a way, that`s not a surprise. Regular readers will know that the Trend Model is based on the application of trend following techniques to global stock and commodity prices. The price volatility experienced for most of 2015 has led to an environment that is unfriendly to trend following models.
Is this just a "feature" of these kinds of models that has to be endured?
A long and short term regime change
Maybe not. In a recent post (see 3 secrets from the Book of (Trend Following) Revelations), I highlighted a study by James Paulsen of Wells Capital Management showing that the long-term trend in equity prices were getting overdone. Paulsen found that stock prices had more or less gone up in a straight line in the last few years and with only minor corrections.

He went on to calculate the rolling three-year R-squared of stock prices and found that they follow cycles of high and low levels of price trends. We just happen to be at the top end of a trending period, which is likely to end soon. When it ends, it will signal an intermediate term top for the US stock market.

In a more recent post (see Calling an audible (for more choppy markets)), I reproduced the Paulsen study and further extended some of the conclusions of that research.
Instead of just looking at the R-squared of 36-month rolling regression, I also examined the R-squared of a 6-month rolling regression as a measure of the short-term trend, largely because my Trend Model uses a much shorter lookback period and it is therefore more correlated with short-term trends than long-term trends. In my last post, I reported that I found that we are in the period where the long term trend is strong (top panel), but the short-term trend is weak (bottom panel).

I further showed that stock prices are likely to roll over in the next few months, given how extended the long-term trend is. In addition, the rollover of the short-term trend is likely a leading indicator of the long trend.

Going back to 1900
I am grateful for all the comments, feedback and suggestions that I have received since I started writing on this topic. One of the comments that I received is that the sample size of this study is absurdly low. I could extend the lookback period of the study using data for the Dow, which goes back to 1900, instead of the SP 500, which only goes back to 1950.
With that suggestion in mind, I reproduced the study using DJIA going back to 1900. Here is the R-squared chart. While the readings are slightly different from the SP 500 study, the longer time horizon revealed some interesting insights. First, the incidence of high 36-month R-squared readings was higher in the pre-1950 period. Nevertheless, the current reading of 0.957 is comparable to the reading of 0.930 in pre-Crash 1987 and 0.911 in pre-Crash 1929. Similarly, the spread between the 36-month and 6-month R-squared readings (bottom panel) is also at a similar order of magnitude when compared to 1987 and 1929.
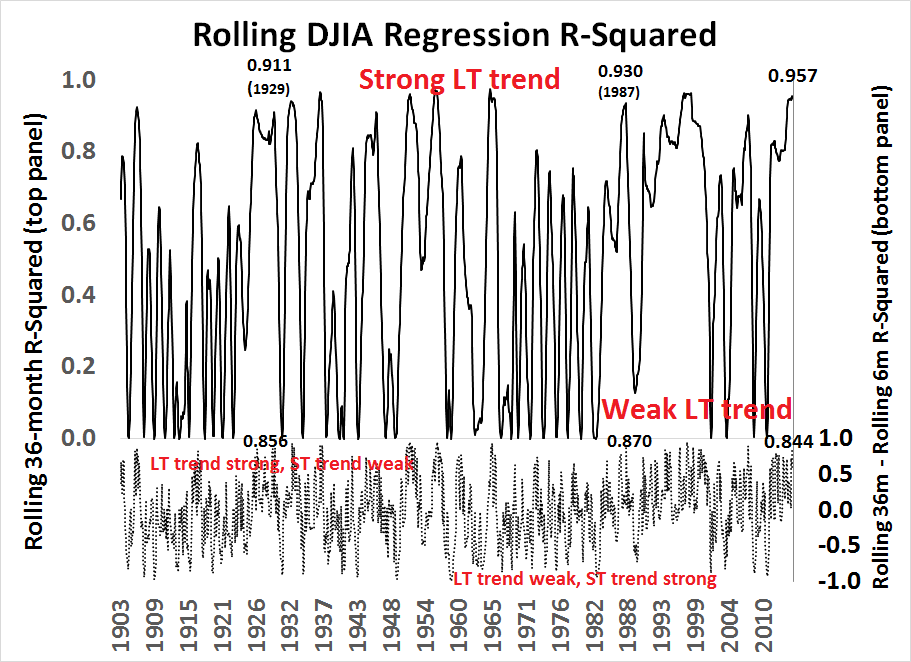
There is an important caveat to remember! This model measures the direction of the move and not the magnitude. Just because the trend is so extended today doesn't mean that a market crash is around the corner. Other episodes have resoled themselves in 10-15% corrections.
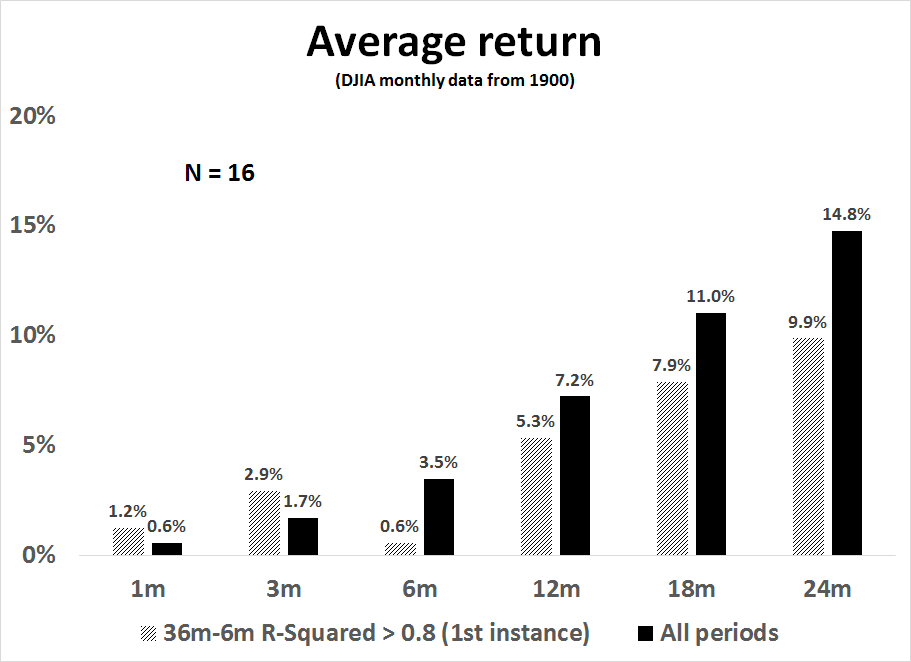
Nevertheless, based on the current 36-month to 6-month R-squared spread of 0.844, I looked at what the return pattern of the DJIA was during past episodes with similar characteristics. The sample size was a more reasonable 16, compared to the minuscule N=4 in the SP 500 study that went back to 1950. The market outperformed initially, but rolled over at between 3-6 months after the first time the spread went above 0.8 (which was March 2015).
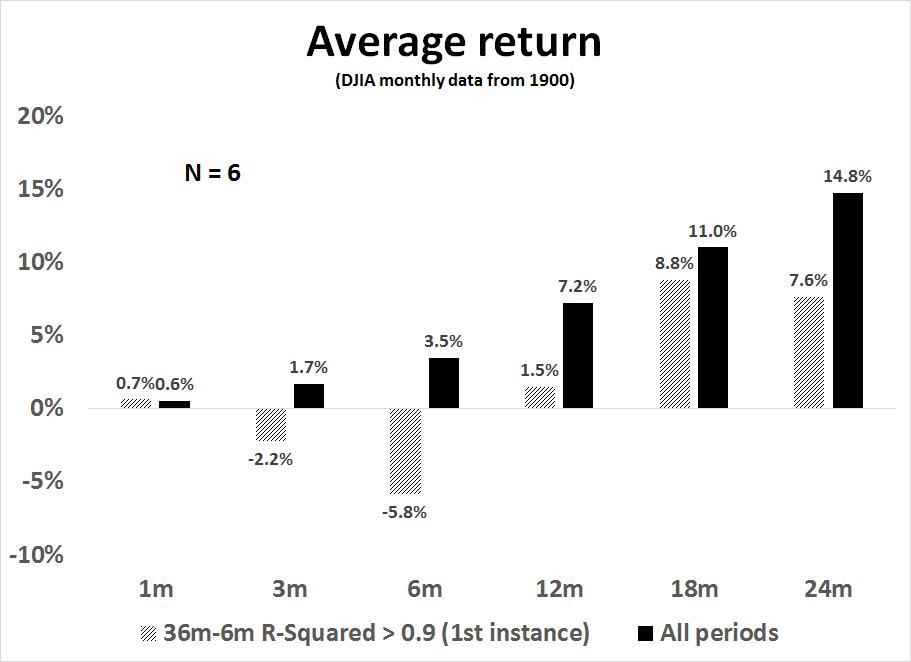
And if the trend got even more extended and the 36 to 6 month spread went to 0.9? The results were more dramatic, as the market declined almost immediately.
Historical analysis from Dana Lyons found a number of narrowly range-bound markets that appeared to coincide with tops in 36-month R-squared readings, though the samples did not totally overlap. Lyons had some good news and bad news for stock investors:
First, the good news. All 9 of the prior ranges saw the SP 500 eventually go on to make new highs, though some initially broke the range to the downside first. 2 months later, 8 of the 9 instances saw the SP 500 not only higher but at a new 52-week high. Only the 2007 instance saw the index lower 2 months later, although it was at a new high 3 months afterward (and it had made a new high immediately following the range break).
Now the not-so-good news. On 5 of the 9 occasions, the new highs were very small and very short-lived. Following occurrences in 1965, 1976, 1983, December 1993 and 2007, the market’s upside “breakout” resulted in tops shortly afterward that would predominantly hold for the following year. Only the occurrences in 1951, 1964 and 1995 saw the market persist at new highs for an extended period of time. Furthermore, only 1995 saw the SP 500 continue on to double digit returns over the following year.
In other words, the market did perform well initially, just as my analysis shows, but they more often than not marked a significant intermediate term top.
Weakening long-term trend, choppy short-term trend
My research results using DJIA data going back to 1900 confirm the conclusions of past studies. We are in an environment where the long-term trend is strong but starting to weaken. The weakness is evidenced by a faltering and choppy short-term trend, or price momentum.
For someone using a trend following techniques with lookback periods similar to the shorter 6-month trend, this suggests that the current unfriendly period for this kind of trend following model is temporary. Under these circumstances, I can choose from four options going forward:
- Status quo: Continue to run the Trend Model as is and accept the drawdowns as a "feature" of the model.
- Wait for a friendly environment: Go to cash and wait for signs that the trending environment has re-established itself.
- Focus on the long-term trend and ignore the short-term trend: Most trend following models use a long term moving average to define the trend, e.g. 200 days, and a short-term moving average for risk control, e.g. 50 days. This approach would throw away the shorter (50 dma) and focus on the longer (200 dma) for trading signals.
- Focus more on counter-trend models. Examples would be contrarian sentiment models looking for crowded longs and shorts, as well as overbought-oversold trading models.
I rejected options 1 and 2 out of hand. Following the status quo is an example of not learning about the investment process and not allowing your first loss to teach you a lesson. Going to cash is a cop-out and detracts from learning. I did consider option 3 seriously, but rejected it as it would result in excessive return volatility because of it strips away the risk control element out of the investment process.
I wound up adopting a version of option 4. I would focus on one side of the counter-trend models by fading strength (but not buying weakness). As my analysis indicates that the long term trend is turning and the decline from an intermediate term top could only be weeks away, buying weakness is the equivalent of picking up pennies in front of a steamroller. Selling strength when the market is overbought, on the other hand, is likely to be a higher percentage play.
The acid test of learning
In conclusion, this is a case study of how I learned about a model from drawdowns. When I interviewed investment managers in the past, I have always asked the acid test question about how they have learned, "Under what circumstances would your investment approach fail?"
If the manager has thought sufficiently about his strategy and he has learned from past mistakes, he will give an intelligent answer. It also shows that he sufficiently understands the kinds of bets that he is making, why it works and when it might fail.
That`s how you learn to make your first loss your best loss.
Cam Hui is a portfolio manager at Qwest Investment Fund Management Ltd. ("Qwest"). This article is prepared by Mr. Hui as an outside business activity. As such, Qwest does not review or approve materials presented herein. The opinions and any recommendations expressed in this blog are those of the author and do not reflect the opinions or recommendations of Qwest.
None of the information or opinions expressed in this blog constitutes a solicitation for the purchase or sale of any security or other instrument. Nothing in this article constitutes investment advice and any recommendations that may be contained herein have not been based upon a consideration of the investment objectives, financial situation or particular needs of any specific recipient. Any purchase or sale activity in any securities or other instrument should be based upon your own analysis and conclusions. Past performance is not indicative of future results. Either Qwest or Mr. Hui may hold or control long or short positions in the securities or instruments mentioned.