Good investors know about the adage that diversification is the only free lunch in investing. But diversification can mean more than just asset class diversification or the number of stocks in a portfolio, it can also refer to model diversification, where you combine models with uncorrelated return streams.
Regular readers will also know about the investment results of my Trend Model (last report card here). The Trend Model is based on the signals of a trend following model as applied to global stock and commodity prices. One of most naturally diversifying class of models to trend following are counter-trend strategies, such as overbought-oversold models or contrarian sentiment models. In the course of studying the dynamics of trend following models and counter-trend strategies, I came to three important observations:
- Bull and bear markets behave differently and therefore they should be traded differently. Bull markets tend to get overbought a lot more easily than bear markets get oversold, which is another way of saying that bear markets are far more emotional than bull markets.
- We may be on the verge of an intermediate term top in US equities. Just as markets become "overbought" and "oversold", so can models. Trend following strategies, when applied to US equities, are becoming "overbought". Momentum is starting to fade and we may be seeing a top building in the US stock market. That process has led to a choppier market, which has created difficulty with trend following returns, but...
- Trend following strategy returns are subject to overbought and oversold conditions too. As the market tops and rolls over, trend following returns will disappoint because of the whipsaws as price momentum flags. However, as the market transforms from a bull to a bear market, that`s when long-only investors need trend following the most as these strategies will go short and profit from falling prices - which is precisely when the diversifying effects of this class of strategy is most valuable. Hence, a good time to commit new funds to a trend following program is when it is suffering from a period of poor returns.
Let me explain.
Have markets been too good for trend following?
The chart below shows the SPX for the last two years. I have imposed a standard 50 and 200 day moving average (dma) as a proof of concept of a trend following system. Supposing that we were to use a simple trading rule of:
- Buy: When the price is above the 50 and 200 dma
- Short: When the price is below the 50 and 200 dma
- Hold cash: All other times
You would have done very well during this period. As the stock market has more or less gone up in a straight line, you would have participated in the rallies while limiting downside drawdown risk during the past two years.
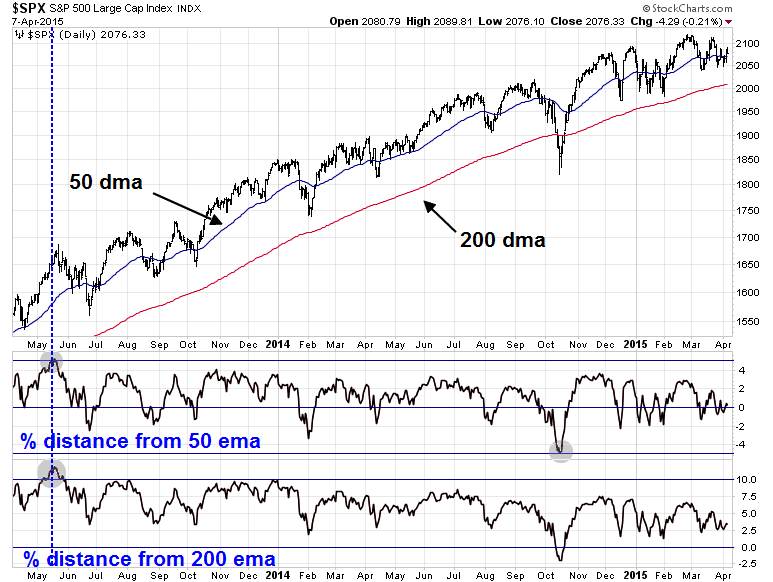
In the bottom two panels, I showed the Percent Price Oscillator (PPO), which measures how far the price of SPX is away from the 50 and 200 exponential moving average (ema) is in percentage terms. The 50 day PPO has varied between +5% and -5% during this period and the 200 day ema has been mostly positive during this time (largely because of the steady market uptrend), but has topped out at around 10%.
Based on these observations, the time to be hypersensitive to counter-trend strategies is when the PPO is "overbought" or "oversold", defined as +/- 5% on the 50 day PPO and +/- 10% on the 200 day PPO. There was one occasion during the last two years - and that was marked by the dotted vertical line on the chart.
Interesting research observation? Not so fast!
How bulls and bears are different
When I stretched my research window out from two to 15 years, the conclusions changed. The chart below shows the same analysis for 15 years. I have also added the 50-200 PPO in the top panel, which measures how far away the 50 ema and 200 ema are away from each other in percentage terms.
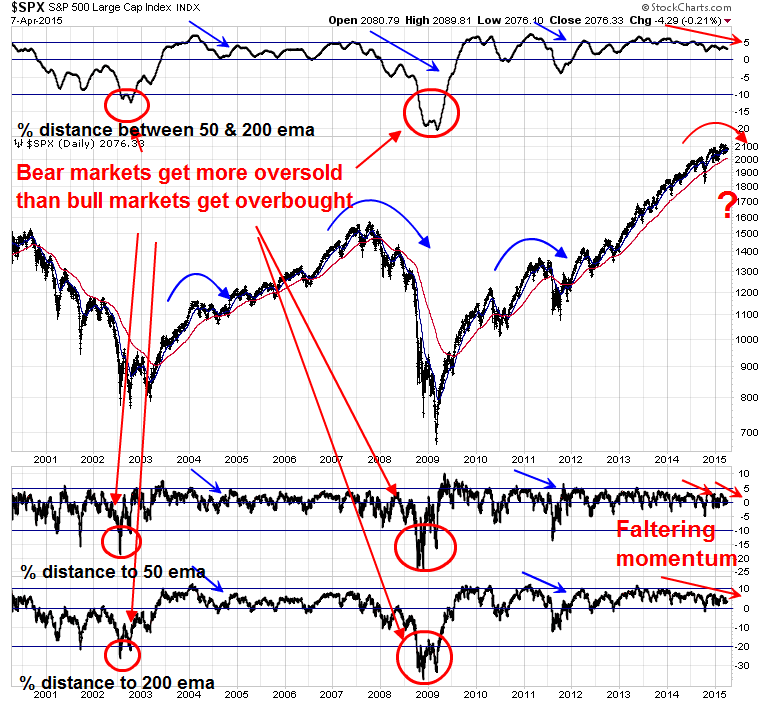
When I examine the PPOs, I noticed that the overbought and oversold levels are very different for bull and bear markets. Bull markets tend to get overbought much more quickly, while bear markets can decline a lot further before the price starts to revert. A more realistic overbought level for the 50 day PPO is 5%, compared to -10% for an oversold reading. Similarly, the threshold for the 200 day PPO is 10% and -20%. We can also observe the same effect in the 50/200 day PPO in the top panel - bull markets get overbought more easily than bear markets get oversold.
My first conclusion: The overbought and oversold thresholds should be asymmetric for bull and bear markets. Apply counter-trend strategies differently, depending on whether you're in a bull or bear phase.
Flagging momentum = Intermediate term top?
Another important observation from the chart above is that we are seeing the PPO starting to fade at a both 50 and 200 day level (marked by the arrows on the chart). Fading PPO means that short term price momentum is flagging. Even though the trend is positive, buying short-term momentum yields lower returns as the strength of momentum surges seem to fade with every rally episode. These conditions are consistent with a recent comment in a post by Brett Steenbarger:
Overall, chasing new highs and stopping out of long positions on expansions of new lows has brought subnormal returns. We have had a trending environment since 2012, but not a momentum environment. Understanding that distinction has been crucial to stock market returns.
In the past, such episodes have been seen during either full-blown bear markets (2000-03, 2007-09) or corrections (2004, 2011), which are marked on the chart.
Research from James Paulsen of Wells Capital Management seem to support that conclusion that we may be on the verge of a market top. Paulsen observed that stock prices have more or less gone up in a straight line. The chart below fitted a trend line to stock prices for the past three years and found that the R-squired came to 97%. In other words, we could be setting up for a Minsky Moment for US stocks (my words, not his).
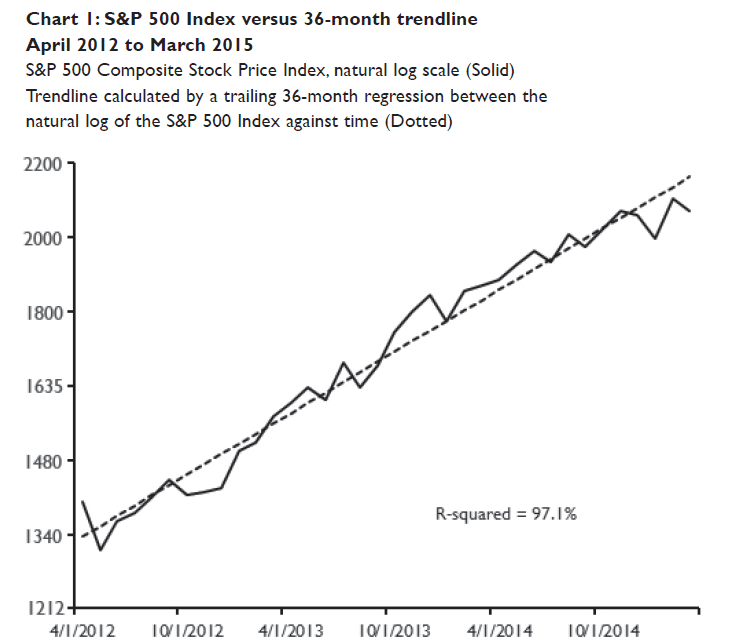
Given that kind of fit, is it any wonder that trend following models have performed so well! Paulsen showed that stock prices haven`t always moved in a straight line as they have recently. Here is the R-squired of rolling fitted trend lines for stock prices since 1900. Note how R-squared has oscillated between 0 and 1 in the last 115 years.
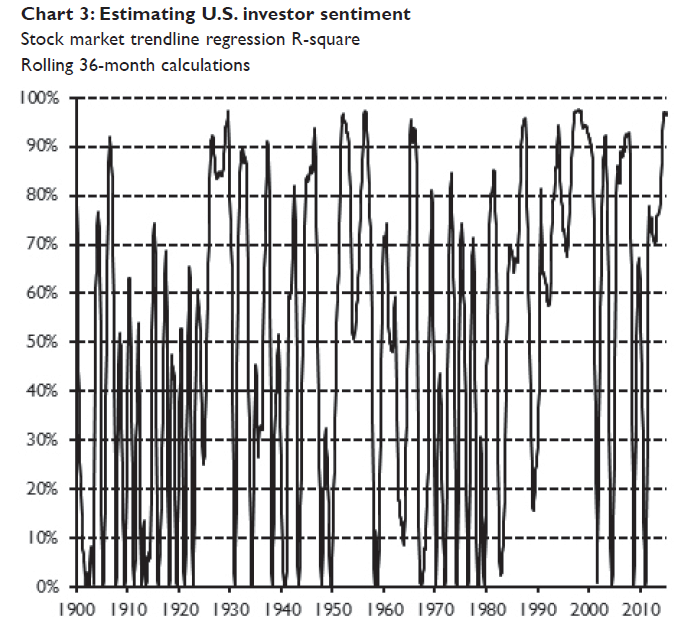
This is starting to look like an overbought-oversold model! In that case, could trend following model returns be getting "overbought"? Maybe. Paulsen went on to show the returns and batting averages of returns by R-squared deciles (recall that the latest R-squared is 97%, or leftmost decile).
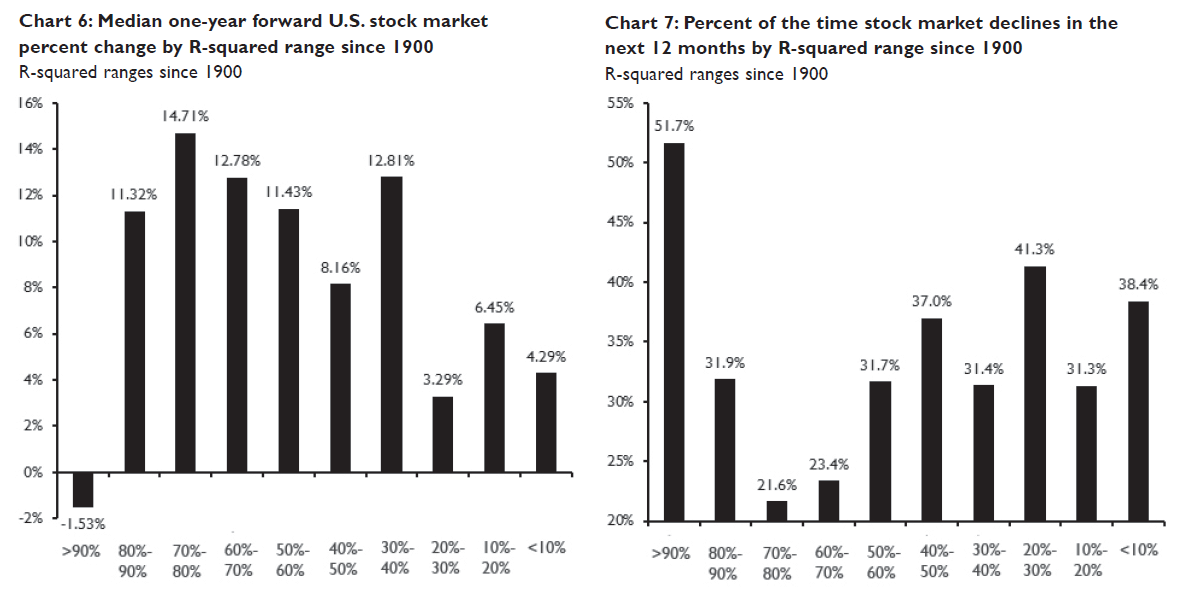
Based on Paulsen`s research and the observation that short-term price momentum is rolling over, we could be seeing early warning signs of an intermediate stock market top. However, I am not panicking just yet. The market tops in 2000 and 2007 were marked by well-defined fundamental bearish drivers, but I am not seeing similar bearish signs from the macro data. If the stock market were to see an intermediate term top, then the most likely outcome is a corrective episode like we saw in 2004 or 2011.
Bear phases are profitable for trend followers
Further research into the characteristics of trend following models led to a more subtle observation. Trend following models are excellent diversifying strategies during bear phases because these kinds of strategies offset long-only portfolio losses because they can and will short the market during bear phases.
Research from AQR Capital Management on what they call "momentum"—which are really trend following strategies—illustrate my point. The x-axis is the return of the SPX, while the y-axis represents an indicative return of a "price momentum" strategy. As the chart shows, as stock prices go negative, momentum relative returns rise to compensate to cushion the effects of the market decline.
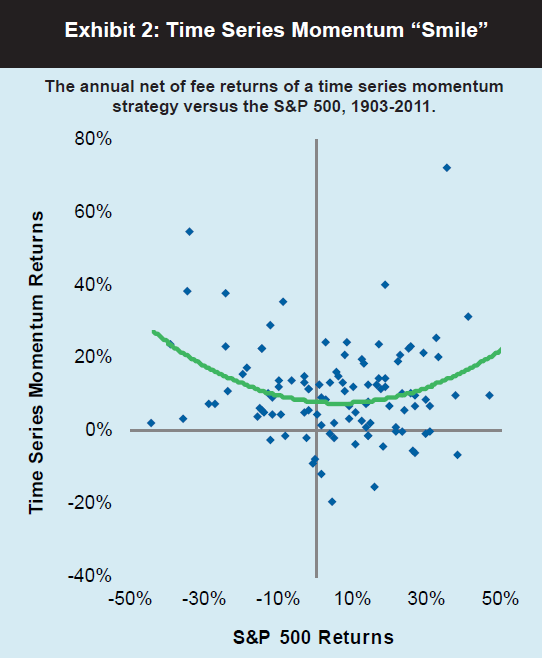
Here is another way of thinking about current market conditions. This is an idealized scenario, but bear with me on this. Stock prices have more or less been going up in a straight line for the last few years (trending), but short-term price momentum is fading and price trends are getting choppy. As a result, trend following returns start to disappoint. If the intermediate term top scenario unfolds as predicted, then stock prices will start to fall. Trend following will see positive returns once more as the model shorts the market.
Such a scenario is consistent with past research which indicates that drawdown periods are excellent opportunities to increase allocation to trend following strategies. As an example, Attain Capital did a study of trend following programs and allocated capital according to the following three sets of rules:
We first tested the ‘normal’ performance, compounding each manager’s returns individually, and then summing the performance of each (you can’t sum the returns and compound the total, as each manager is only trading the portion of the total allocated to them, and isn’t increasing or decreasing positions based on the movements of the overall portfolio). This is the hold tight, or ‘call’ method, where you rely on the portfolio as a whole to protect you against drawdowns in individual managers.
We then tested the ‘fold’ method, whereby you set a line in the sand at 1.5 times max drawdown, exit the program if that level is hit, and then replace it with the program showing the highest past 12 month Sharpe ratio that is not already traded or has been traded. This method resulted in 7 different programs coming into the portfolio over the 8 year period, as three of the original programs hit their lines in the sand; and four of the replacement programs hit their stop points. We started this portfolio with even weightings for each manager, and then used that same initial weighting for a replacement program if it was replacing a program which had lost money; and used the current allocation of the program being replaced if it had made money since inception.
Finally, we tested the ‘raise’ method, where you don’t just sit tight and you don’t head for the exits; you actually stare down the drawdown and increase your allocation. For this method, we tested using 50% of the past historical drawdown and 100% of the past historical drawdown as trigger points for doubling the allocation to whichever manager hit those drawdown levels. We also assumed this double allocation was only done until the program returned to equity highs, and that it was done with no extra capital - only with an increase in the nominal trading amount.
As it turned out, the "raise" method, which doubles down on losing trend following programs, had the best returns. It beat the buy-and-hold benchmark, which outperformed the "fold" method, which panicked out of programs that saw excessive drawdowns.
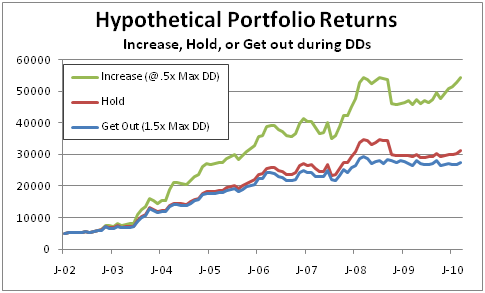
Conceptually, these results are consistent with the idea that trend following strategies can have overbought and oversold conditions. The research from Wells Capital Management, which showed that 3-year R-squared can oscillate between very low (high drawdown) levels to very high (high returns) is another way of thinking about this issue.

Don't panic!
One last word.
Despite my conclusions about a possible top, I would reiterate my observation that investors shouldn't panic over the prospect of a possible intermediate term top in US stocks. The fundamental drivers of a major bear market are absent and if the market should top out, it will most likely be a correction.
It would be entirely appropriate for James Paulsen should have the last word on this matter:
Our advice is to stay overweighted equities but to diversify away from the U.S. toward offshore stock markets. Most international markets have underperformed U.S. stocks in the last few years and currently offer more attractive relative valuations. Moreover, investors can diversify away from increasingly hostile U.S. policy officials toward hospitable policies for the foreseeable future in both the eurozone and in Japan.
Don't panic, diversify - it's the only free lunch in investing.
Disclosure: Cam Hui is a portfolio manager at Qwest Investment Fund Management Ltd. ("Qwest"). This article is prepared by Mr. Hui as an outside business activity. As such, Qwest does not review or approve materials presented herein. The opinions and any recommendations expressed in this blog are those of the author and do not reflect the opinions or recommendations of Qwest.
None of the information or opinions expressed in this blog constitutes a solicitation for the purchase or sale of any security or other instrument. Nothing in this article constitutes investment advice and any recommendations that may be contained herein have not been based upon a consideration of the investment objectives, financial situation or particular needs of any specific recipient. Any purchase or sale activity in any securities or other instrument should be based upon your own analysis and conclusions. Past performance is not indicative of future results. Either Qwest or Mr. Hui may hold or control long or short positions in the securities or instruments mentioned.
