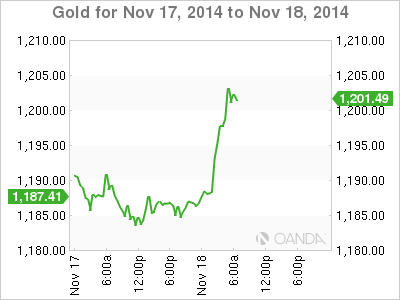
Gold prices continued to move higher on Tuesday and has broken above the key resistance line of $1200. On the release front, today’s highlight is US Producer Price Index, a key inflation indicator. The markets are expecting another weak reading, with an estimate of -0.1%.
ECB head Mario Draghi and his colleagues are under strong pressure to “do something” to kick-start the weak Eurozone economy. Deep interest rate cuts haven’t had much effect, so the ECB has purchased covered bonds and asset-backed securities. So far, these securities have been from the private sector, and the ECB could decide to expand these purchases to government bonds, known has quantitative easing. However, there is resistance to quantitative easing from national central banks, such as the powerful Bundesbank. Speaking before a European parliamentary committee on Monday, Draghi said that further stimulus measures could include quantitative easing.
US consumer indicators looked strong on Friday. Retail Sales and Core Retail Sales both posted gains of 0.3%, edging above the estimate of 0.2%. UoM Consumer Sentiment continued its upward trend, climbing to 89.7 points in November. This was the indicator’s strongest performance since July 2007. Meanwhile, US Unemployment Claims has looked solid in recent readings, but the key indicator jumped to 290 thousand, missing the estimate of 282 thousand. This marked a seven-week high for the key indicator. The news wasn’t any better from JOLTS Jobs Openings, which weakened to 4.74M, down from 4.84M a month earlier. The estimate stood at 4.81M.

XAU/USD November 18 at 12:10 GMT
XAU/USD 1201.51 H: 1204.65 L: 1183.37
XAU/USD Technical
| S3 | S2 | S1 | R1 | R2 | R3 |
| 1156 | 1175 | 1200 | 1215 | 1240 | 1255 |
- XAU/USD was flat in the Asian session. The pair has posted strong gains in the European session, climbing above the key 1200 line.
- The round number of 1200 has reverted to a support line but remains fluid. 1175 is next.
- 1215 is an immediate resistance line. 1240 follows.
- Current range: 1200 to 1215.
Further levels in both directions:
- Below: 1200, 1175, 1156, 1130 and 1111
- Above: 1215, 1240, 1255 and 1275
OANDA’s Open Positions Ratio
XAU/USD ratio is pointing to long positions on Tuesday. This is consistent with the pair’s movement, as gold continues to rally against the dollar. The ratio has a majority of long positions, indicative of trader bias in favor of gold moving to higher levels.
XAU/USD Fundamentals
- 13:30 US PPI. Estimate -0.1%.
- 13:30 US Core PPI. Estimate 0.2%.
- 15:00 US NAHB Housing Market Index. Estimate 55 points.
- 18:30 US FOMC Member Narayana Kocherlakota Speaks.
- 21:00 US TIC Long-Term Purchases. Estimate 41.3B.
