
Talking Points
- Gold and Silver See Modest Gains As The USD Retreats Ahead of Upcoming Data
- Crude Oil Advances Towards The 95 Handle On Robust Demand Speculation
- Palladium Trades Near 15 Month Low As Technicals Warn Of Further Weakness
Gold and silver are cautiously advancing in Asian trading today as the USD index retreats from its highest level in four years. Upcoming US Consumer Confidence data may offer some potential to recharge the greenback’s batteries. The gauge of sentiment in the world’s largest economy is tipped to climb to its highest since 2007. This in turn could keep firm Fed policy normalization bets intact and weigh on the precious metals. At the same time after 11 consecutive weekly advances the US Dollar’s bull run is in danger of becoming exhausted, which could afford gold some breathing room.
Turning to the energy space; another round of strong US economic data may hold the potential to bolster WTI. Speculation over robust demand from the world’s largest consumer of the commodity has likely helped the crude benchmark rebound over the past week. Yet with lingering global supply glut concerns a sustained recovery for crude oil over the longer-term remains questionable.
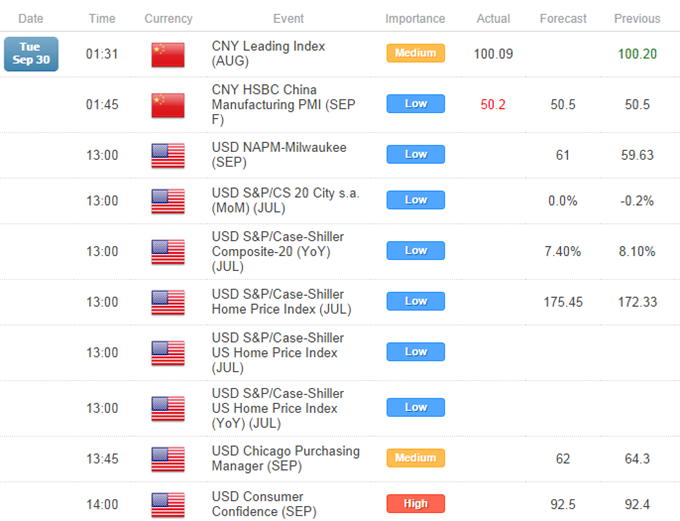
Meanwhile, copper has looked past the release of the final reading for the HSBC China Manufacturing PMI for September. The leading indicator slipped back to 50.2 after a preliminary reading of 50.5 crossed the wires last week. Tomorrow will bring the release of the official figure which is tipped to decline for the second consecutive month. This in turn could keep Chinese growth deceleration fears alive and weigh on the base metals.
As a final note, the recent eruptionof unrest in Hong Kong may offer some background noise for the commodities. Generally periods of political turmoil can be accompanied by safe-haven demand for the alternative assets including gold. However, such fear-driven positioning seldom delivers a lasting source of support for the precious metals.
UPCOMING ECONOMIC EVENTS

CRUDE OIL TECHNICAL ANALYSIS
Crude oil has cleared its descending trendline on the daily yet has been left hanging below the next key hurdle (the 95.00 barrier). A daily close above the nearby ceiling alongside signs of an emerging uptrend (ROC and 20 SMA) may open a climb towards the 38.2% Fib. at 96.98.
Crude Oil: Sentiment Shifting Following Climb Over Trendline Resistance

GOLD TECHNICAL ANALYSIS
Gold continues to endure a consolidation between the 1,208 and 1,222 congestion zone. A parade of short body candles suggests some hesitation from traders to lead the precious metal lower. Yet against the backdrop of broader downtrend a daily close below the 1,208 floor would open the next leg lower to the 2013 lows near 1,180.
The DailyFX Speculative Sentiment Index suggests a mixed bias for gold based on trader positioning.
Gold: Awaiting Clearance From Congestion Zone Between 1,208 and 1,222

SILVER TECHNICAL ANALYSIS
Silver’s slide under the 17.75 barrier alongside the continued presence of a downtrend (signaled by the 20 SMA and ROC) leaves the immediate risks lower. A daily close below the 17.30 mark would shift the spotlight to the low seen in late March ’10 near 16.50. A climb over trendline resistance and the 18.19 mark would be required to warn of a base and suggest a recovery for the precious metal.
Silver: Immediate Risks Remain Lower

COPPER TECHNICAL ANALYSIS
The copper bears have shown signs of exhaustion near the 3.01 floor as denoted by a Doji candlestick on the daily. Yet within the context of a short-term downtrend a close below the nearby barrier would open the next leg lower to 2.96.
Copper: Awaiting Close Below Nearby Barrier To Open Next Leg Lower

PALLADIUM TECHNICAL ANALYSIS
Some buying interest for palladium appears to have been renewed at the 61.8% Fib near 780 which has yielded a Harami pattern. Yet the bullish reversal formation may struggle to find follow-through amid a core downtrend. This leaves it awaiting a daily close below the 780 floor to generate a push towards the April lows at 765.
Palladium: Sustained Recovery May Prove Difficult Amid Downtrend

PLATINUM TECHNICAL ANALYSIS
Platinum has found some bids at the July ’13 low near 1,308 which has prompted the emergence of a Piercing Line pattern. Yet without confirmation from a successive up period and amid a sustained downtrend the 1,285 floor looks achievable. A daily close above former support-turned-resistance at 1,314 would be required to suggest a base has formed.
Platinum: Reversal Signal Lacking Confirmation Near Buying Support
